|
|
Table of Contents
Quadrant Lines
Introduction
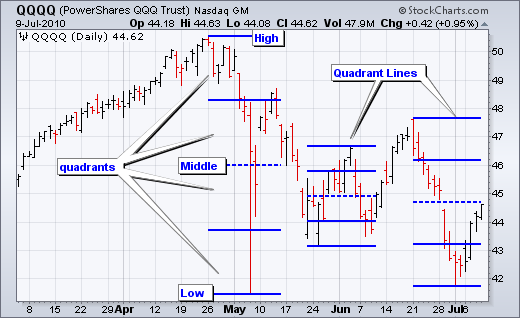
Quadrant Lines divide the high-low range into four equal sections. There are five lines and four quadrants. The top line marks the high, the bottom line marks the low and the other three lines form the quadrants. The middle line marks the midpoint of the range. Quadrant Lines are not an indicator as such. Instead, they are used as a measuring stick for price action. Quadrant Lines allow chartists to visually quantify price levels relative to the defined range.
Calculation
Quadrant Range: High to Low
Quadrant Size: (High - Low)/4

Bottom Line = Low
First Line = Low + Quadrant Size
Middle Line = First Line + Quadrant Size
Third Line = Middle Line + Quadrant Size
Top Line = High

********************************************

Quadrant Range: 60 to 40
Quadrant Size: (60 - 40)/4 = 5

Bottom Line = 40
First Line = 40 + 5 = 45
Middle Line = 45 + 5 = 50
Third Line = 50 + 5 = 55
Top Line = 60
Interpretation
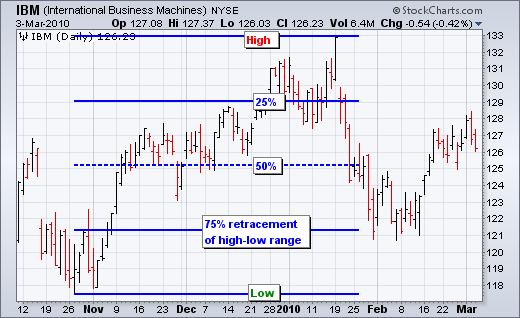
Quadrant Lines provide a visual reference for current prices relative to the defined high-low range. As you can see from the formula, quadrants are the same size because each equals 1/4 or 25% of the high-low range. After an advance, Quadrant Lines allow chartists to quickly identify price points that retrace 25%, 50% and 75%. Prices have retraced 50% when they reach the middle quadrant line. Corresponding retracements can also be seen when drawing Quadrant Lines over a decline. Chartists can easily identify advances that retrace 25%, 50% or 75% of the defined decline.
Log Scaling
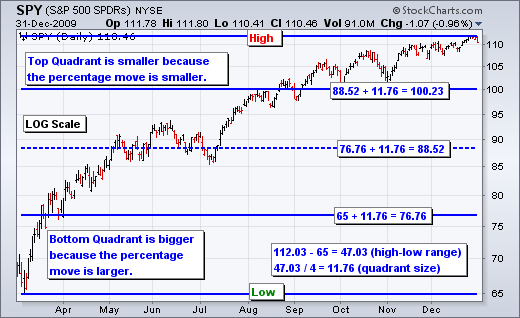
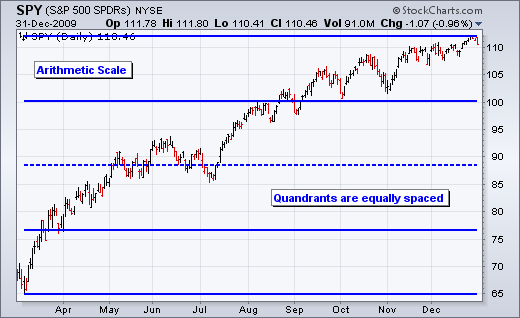
Quadrant Lines might not look equidistant on the log scale, but they are equidistant in absolute terms. Log scaling shows price movements in percentage terms. An advance from 65 to 75 is 10 points in absolute terms or 15.3% in percentage terms. An advance from 100 to 110 is also 10 points, but much less in percentage terms (just 10%). A 10 point 15.3% move on a log scale will appear bigger than a 10 point 10% move. A 10 point move on an arithmetic scale will look the same regardless of the starting point (65 or 100). For this reason, the bottom quadrant may appear bigger than the top quadrant when using log scaling. Even though the point moves are equal, an equal advance from a lower starting point produces a bigger percentage gain, which is reflected in the log chart.
Advance with Retracement
Chart 4 shows IBM with the Quadrant Lines covering an advance from late October to mid-January. The stock firmed near the 75% retracement, which is the top of the lowest quadrant. This is not an argument for 75% as a key retracement that chartists should watch carefully. Quadrant Lines simply help chartists quantify the depth of the pullback.
Decline with Retracement
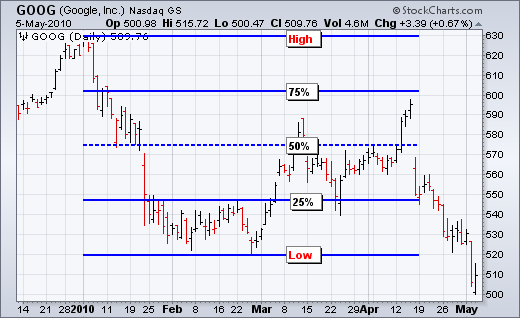
Chart 5 shows Google (GOOG) with the Quadrant Lines covering the decline from early January to late February. GOOG exceeded the 25% and 50% retracements with the advance above 590, but did not exceed the 75% retracement.
Conclusion
Quadrant Lines can be used to identify retracements or determine the relative location of current prices within a given high-low range. Even though these lines are not indicators per se, there are some similarities with the Fibonacci Retracements Tool, which uses 38.2%, 50%, and 61.8% retracements. After an advance, a decline that retraces only 25% would be deemed shallow and could be used as a sign of strength. A decline that retraces 75% could be deemed excessive and the most one could expect from a correction. This could be viewed as the last reversal point before the move returns all the way back to the original low. As with all indicators and line studies, Quadrant Lines should be used in conjunction with other aspects of technical analysis.
SharpCharts
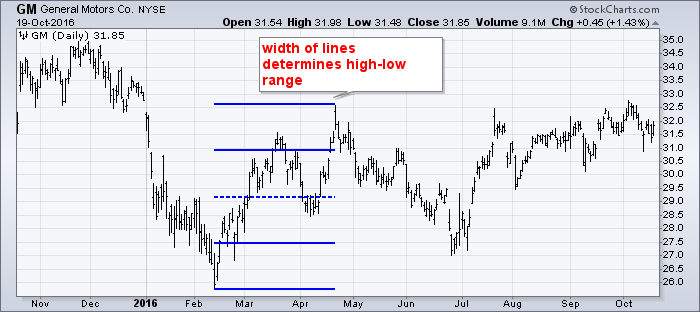
You can use our ChartNotes annotation tool to add Quadrant Lines to your charts. Below, you'll find an example of a chart annotated with Quadrant Lines.
To learn more about how to add this annotation to your charts, check out our Support Center article on ChartNotes' Line Study Tools.
