
|
Table of Contents
Introduction to Elliott Wave Theory
Introduction
Elliott Wave Theory is a method of market analysis, based on the idea that the market forms the same types of patterns on a smaller timeframe (lesser degree) that it does on a longer timeframe (higher degree). These patterns provide clues as to what might happen next in the market. According to the theory, it does not depend on what timeframe you are analyzing; market movements follow the same types of patterns.
The theory was developed by R.N. Elliott in the 1930s and was popularized by Robert Prechter in the 1970s. It claims that crowd behavior produces patterns and trends we see in markets; wave pattern, as defined by Elliott, is the physical manifestation of mass psychology in our world. These patterns not only appear in markets but anywhere humans make decisions en masse. Examples might include housing prices, fashion trends or how many people choose to ride the subway each day.
In this section, we will introduce the rules of wave formation and the various patterns seen in Elliott Wave Theory. By the end of this section, you should have a good grasp on how Elliott Wave is applied and be able to form your own Elliott Wave analysis on charts. However, keep in mind that it takes practice to confidently apply Elliott Wave Theory.
Basic Sequence
Motive Waves
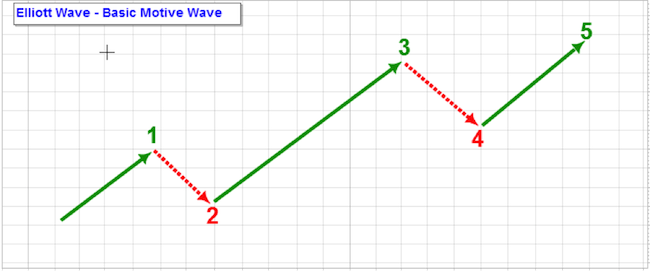
The first half of an idealized Elliott Wave pattern is the Motive Wave, a wave that always advances in the direction of the trend of one larger degree. It is subdivided into five smaller waves, which are labeled 1, 2, 3, 4 and 5, as illustrated in the above chart. Within the motive wave, there are two types of smaller sub-waves: the Impulse Wave and the Diagonal Wave. Each will be explained in Part 3 of this article series.
You will notice in the chart that three of these sub-waves advance (waves 1, 3 and 5) and two of them correct or move downward (2 and 4). Waves 1, 3 and 5 in the motive wave are called “actionary” sub-waves. These are usually motive waves themselves, in that they move in the same direction as the trend of one larger degree. Waves 2 and 4 are “corrective” sub-waves, moving in the opposite direction of the larger trend. The motive wave tends to move with relative ease in the direction of the larger trend. Consequently, it is easy to spot and interpret.
There are three rules for Motive Wave formation that must be satisfied:
- Wave 2 always retraces (gives back) less than 100% of Wave 1.
- Wave 4 always retraces less than 100% of Wave 3.
- Wave 3 always travels beyond the end of Wave 1 and is never the shortest wave.
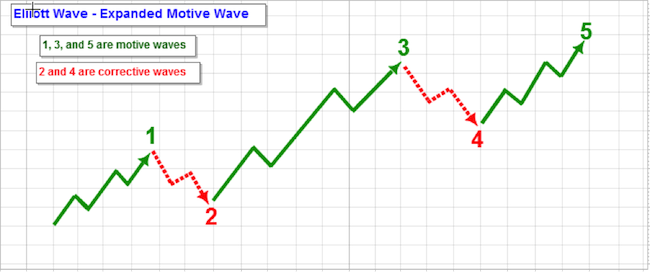
If we consider the actionary sub-waves as having five waves each, and the corrective sub-waves as having three waves each, then the larger motive wave would look something like the chart below. In this case, the actionary sub-waves are five waves each because they are in the direction of the trend of one larger degree - the larger motive wave. This type of pattern is labeled as a 5-3-5-3-5 structure.
Corrective Waves
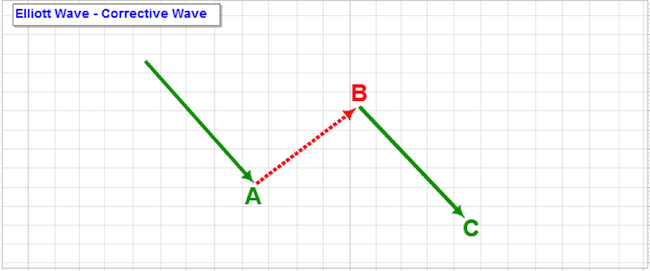
In general, the corrective wave is depicted as a three-wave structure, as seen in the chart above. The three-wave structure has its sub-waves labeled as waves A, B and C. This can be misleading since not all corrective waves are exactly three-wave structures. The specifics of corrective wave structures will be discussed later, but for our general purpose, we will start with describing them as having three sub-waves.
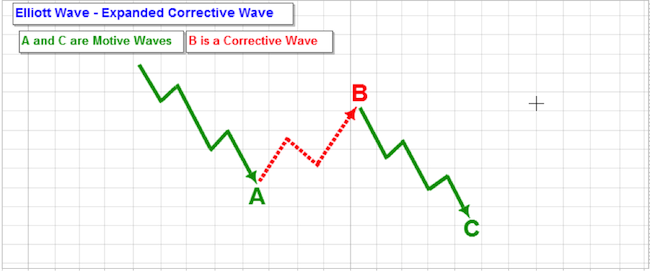
If we look at the structure, we will notice that Wave A and Wave C are both in the direction of the trend of one higher degree - in this case, the direction of the correction. Because of this (for this general example) we will show them as motive waves, each having a total of five waves. Wave B is traveling against the direction of the larger correction (trend of one higher degree) and will therefore be shown as having three waves. This type of pattern is labeled as a 5-3-5 structure.
Basic Cycle Structure
The combination of a motive wave and a corrective wave is the general structure of the complete Elliott Wave cycle. This is illustrated as a structure with a total of eight waves. There is a five-wave advance (motive) in the direction of the trend of one larger degree, followed by a three-wave correction against the higher degree trend.
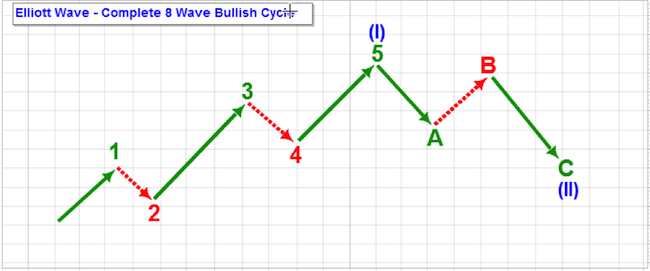
The chart above shows the eight-wave sequence with a rising five-wave motive wave and a falling three-wave correction. You will notice that this movement, from beginning to end, finishes higher than it started (i.e., price increased). If you think about it, a 5-3 structure is the minimum requirement to achieve both fluctuation and progress in an up or down direction. Markets fluctuate - rise and fall - and they advance either up or down as they progress.
Elliott noticed that the market repeated this 5-3 structure again and again. This was the foundation of his theory and is the general Elliott Wave cycle structure.
Once the cycle ends, it begins again. It is expected that the market will make another five-wave advance after a correction ends.
Please note that this does not necessarily mean five waves up and three waves down. In a declining trend, the pattern will advance down and correct higher. That means there will be a five-wave down sequence followed by a three-wave up sequence.
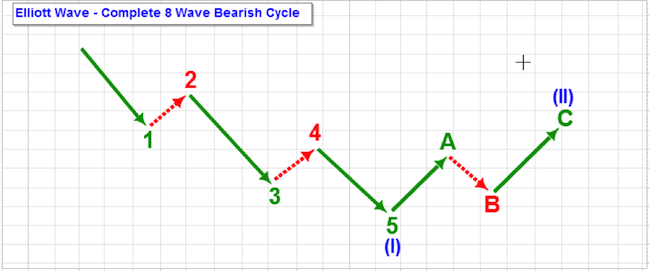
The chart above shows this eight-wave structure in a declining market. Of course, it ends lower than where it started. If you saw this pattern on a chart, depending on the larger picture, you might expect another five waves down.
Please keep in mind that this is simply a motive wave and a corrective wave. All markets advance and correct. The Elliott Wave Theory provides specific types of patterns that the market uses to do this, which we will cover below, but it all fits within this general cycle structure.
Fractal Nature
If we incorporate our expanded motive and corrective waves together, we will see that they make a more detailed general Elliott structure. We can see five advancing waves in the motive wave that make up Wave I, as well as three declining waves in the corrective wave that make up Wave II. However, notice that in Waves 1 and 2 of Wave I, the general Elliott structure forms. This structure forms on both a larger scale and a smaller scale within the same picture.
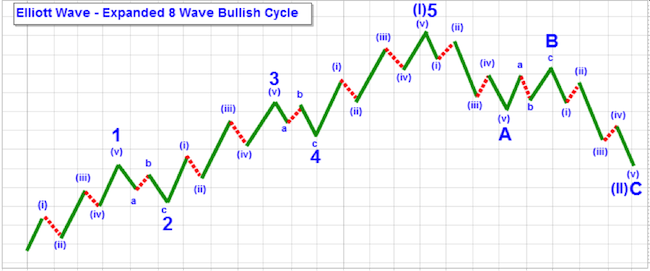
This is an example of the fractal nature of the Elliott Wave patterns. A fractal is a curve or geometric figure, each part of which has the same statistical character as the whole, and anything that resembles this type of formation is said to be fractal. Within the Elliott Wave structure, this is evidenced by the expanding and contracting similarity of wave structures. Wave I is the next higher degree of trend for Wave 1, but within Wave 1 and 2 is the 5-3 pattern of the full Elliott Wave cycle. The 5-3 pattern then repeats for Waves 3 and 4, and for waves A and B as well (except in the declining direction).
There are actually three degrees of trend shown in the chart above. Waves I and II form the larger degree cycle. The next degree down are the waves that are labeled 1, 2, 3, 4, 5, A, B, and C. And the next degree down are the waves labeled i, ii, iii, iv, v, a, b, and c. In theory, this pattern expands to infinity and shrinks to infinity and constitutes what is known as a fractal, an infinitely contracting and expanding pattern.
Elliott discovered, by observation, that the markets were fractal in nature. No matter how big or small the wave degree, motive waves take on a 5-wave sequence and corrective waves usually take on a 3-wave sequence. He classified patterns that showed up in higher degrees of trend and saw that those same types of patterns repeated on lower degrees of trends.
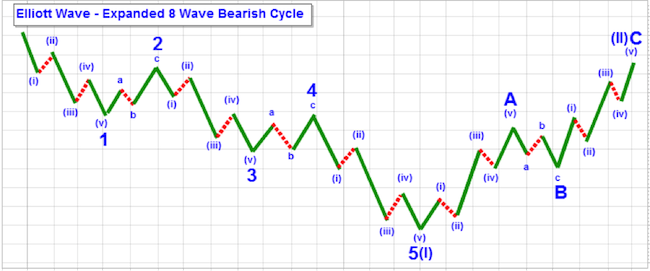
The chart above shows the same picture in a declining market. See if you can spot the different degrees of trend.
Elliott Wave is not a trading technique. There are no specific rules of entry or exit, nor is there one “right” way to use it in trading. As a result, the use of Elliott Wave has been avoided by many traders and technical analysts, not due to a lack of understanding but because of the apparently subjective nature of how it may be applied. Nonetheless, there are those who have successfully used Elliott Wave patterns in their trading. The Theory continues to attract a wide following, both with individual investors as well as professional traders. Advocates tend to apply various indicators to help them in trading specific Elliott Wave patterns, although those techniques are unique to the people who developed them.
If you are going to perform Elliott Wave analysis, you will be making “wave-counts.” This simply means that you will be labeling the waves to see how they conform to the Elliott Wave pattern, allowing you to anticipate market movement. The next section will give you some guidelines on labeling the wave-counts.
Next Article in this Series: Identifying Elliott Wave Patterns