|
|
Table of Contents
Advance-Decline Volume Percent
What Is the Advance-Decline Volume Percent Indicator?
Advance-Decline Volume Percent is a breadth indicator designed to measure the percentage of Net Advancing Volume. AD Volume Percent is the foundation for a breadth oscillator or the AD Volume Line. These indicators can then complement the analysis of the underlying security. For example, the AD Volume Line based on AD Volume Percent for the Consumer Discretionary SPDR (XLY) would complement the analysis of XLY. After the market closes, StockCharts.com calculates this indicator's value for the nine sector SPDRs and several indexes. This article explains how to use this indicator effectively using illustrative SharpChart examples. A list of sample symbols can be found at the end of this article.
How Do You Calculate Advance-Decline Volume Percent?
StockCharts.com has AD Volume Percent data going back several years. Note, however, that these calculations are based on the list of stocks in the underlying security or index (i.e., XLK), which do change. This means the breadth data from two years ago is based on the then-current holdings, which may be different from the present-day holdings. Even though the holdings for the nine sector SPDRs and major indexes are relatively stable, chartists should consider this if using a long-term chart.
AD Volume Percent = (Advancing Volume Less Declining Volume) / Total Volume
AD Volume Percent = (36m – 5m) / 41m = +31/41 = +75.60%
AD Volume Percent = (7m – 36m) / 43m = -29/43 = -67.44%
In the first numerical example, the total volume is 41 million shares, the advancing volume is 36 million shares, and the declining volume is 5 million shares. AD Volume Percent is positive (+75.60%) because advancing volume is greater than declining volume. In the second example, total volume is 43 million, advancing volume is 7 million and declining volume is 36 million. AD Volume Percent is negative (-67.44%) because declining volume is greater than advancing volume.
Click here for a live version of the chart.
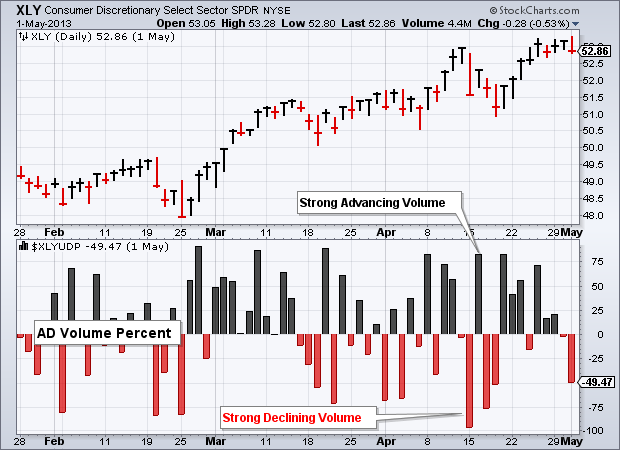
As the chart above shows, AD Volume Percent fluctuates between -100% and +100% with zero as the middle line. A +100% reading means all volume went to advancing stocks. In other words, all stocks closed higher on the day. A -100% reading means all volume went to declining stocks. Extreme readings are the exception rather than the norm.
How Do You Interpret Advance-Decline Volume Percent?
As a breadth indicator, AD Volume Percent measures the money flow behind a particular move. An advance with AD Volume Percent exceeding 70% shows strong buying pressure because most of the volume went into advancing stocks. Conversely, a decline with AD Volume Percent dipping below -70% reflects strong selling pressure.
The raw data fluctuates with the up and down days, creating a rather choppy-looking chart. Nevertheless, chartists can compare the positive and negative days to assess buying and selling pressure. Chartists can apply a moving average to create an oscillator. Chartists can also create an AD Volume Line to assess the overall trend and look for divergences.
AD Volume Line
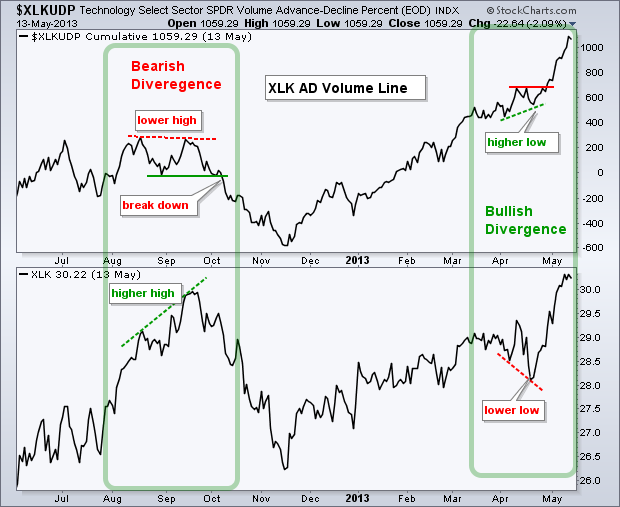
The chart below shows the AD Volume Line for the Technology SPDR (XLK) in the top window and XLK in the lower window. The AD Volume Line is a cumulative measure of AD Volume Percent for XLK ($XLKUDP). The line rises when AD Volume Percent is positive and falls when AD Volume Percent is negative. The values on the right-hand scale are not important because these values depend on the starting date. Chartists should simply focus on line movements and apply basic technical analysis.
Click here for a live version of the chart.
There are two “technical developments” visible on this chart. First, notice that a bearish divergence formed in August-September. XLK moved to a new high in September, but the AD Volume Line did not confirm this high and formed a lower high. This bearish divergence reflected weaker buying pressure on the September advance.
Second, there was a bullish divergence in April. Notice how XLK dipped below its early April low in late April, but the AD Volume Line formed a higher low. This higher low indicated that downside volume (selling pressure) was not that strong during the April pullback. Weak selling pressure set the stage for a rebound in buying pressure and a break to new highs in XLK.
Moving Averages
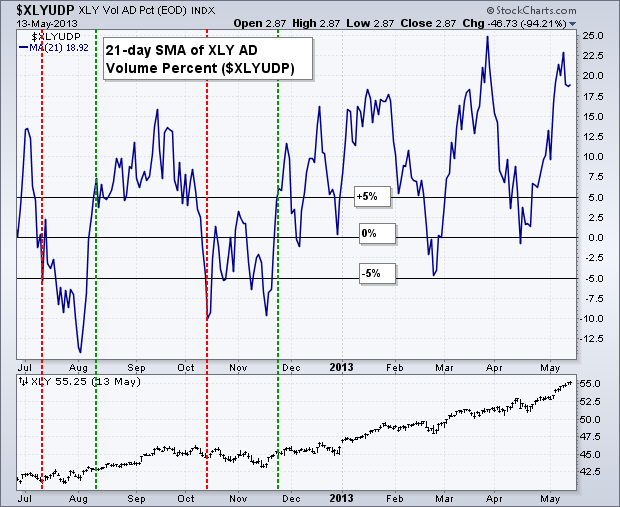
A moving average can be applied to AD Volume Percent to create an oscillator that fluctuates above/below the zero line. Technically, this is not a momentum oscillator, but the resulting breadth oscillator fluctuates above/below the zero line and can be used just like a momentum oscillator. Chartists can look for this moving average to cross a particular threshold and look for divergences to produce signals. More aggressive traders can even look for overbought and oversold levels.
Click here for a live version of the chart.
The chart below shows the 21-day simple moving average for AD Volume Percent of XLY ($XLYUDP). The actual $XLYUDP plot is invisible, which is a setting that can be applied under Chart Attributes/Type. The horizontal lines are set at +5%, 0% and -5%. Notice that crosses above/below the zero line are quite susceptible to whipsaws and bad signals. Traders would be better off using bullish and bearish thresholds just above/below the zero line. In this example, a move above +5% is deemed bullish and a move below -5% is deemed bearish. These signals are highlighted with the red and green lines. Don’t go looking for the perfect signal because all oscillator systems will produce their share of whipsaws and bad signals.
The Bottom Line
AD Volume Percent is a breadth indicator that measures buying and selling pressure within a particular group of stocks. The underlying security price (i.e., XLK) reflects what is happening on the outside. AD Volume Percent for XLK ($XLKUDP) shows what is happening on the inside. Changes sometimes occur on the inside first; breadth indicators can help chartists anticipate these changes. The AD Volume Line is a cumulative indicator that can be used for short-term and long-term analysis. A moving average of AD Volume Percent is more sensitive and acts like a momentum oscillator.
SharpCharts
Click here for a live version of the chart.
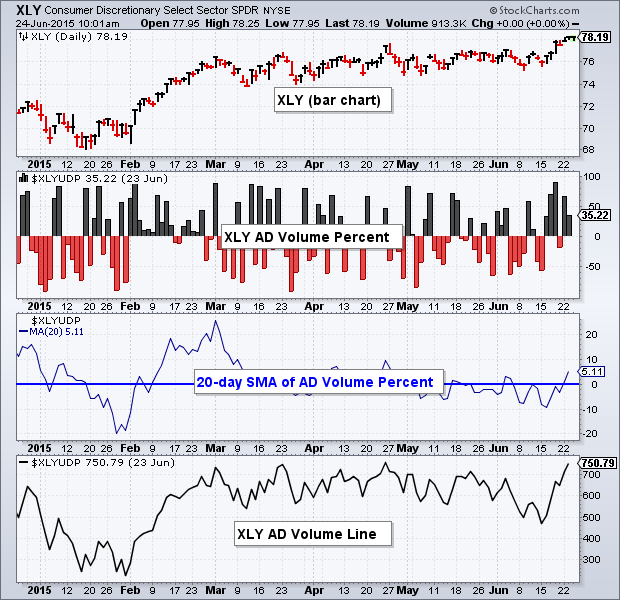
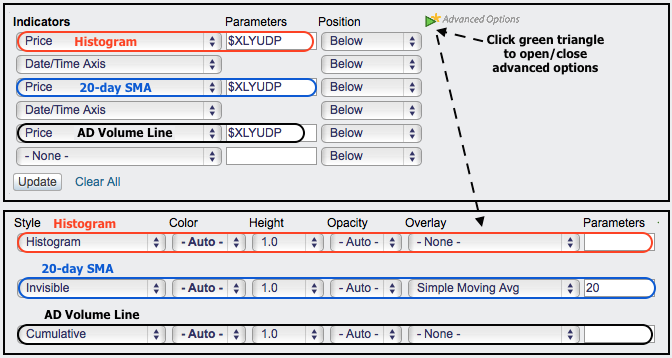
AD Volume Percent can be added to any SharpChart using the appropriate symbol (see list below). The example below shows SharpChart settings for the histogram, 20-day SMA and AD Volume Line. The raw data should be shown as a “histogram” chart to best capture the ups and downs (red). AD Volume Percent can be turned into a breadth oscillator by choosing “invisible” for chart type to hide the raw data. Next, add a moving average in the “Overlays” section. Choosing invisible in the first step will ensure that the moving average becomes the main security. Chartists can easily create an AD Volume Line by setting the chart type to “cumulative” (black).
Symbol List
StockCharts.com users can access an up-to-date list of symbols for all our Advance-Decline Volume Percent indicators. From this list, click the “Mentions” icon to the right of a specific symbol for more details about the symbol and recent mentions in Public ChartLists, blog articles, and more.
Advance-Decline Volume Percent FAQs
What is Advance-Decline Volume Percent?
Advance-Decline Volume Percent is a breadth indicator that measures the percentage of Net Advancing Volume. It can complement the analysis of the underlying security.
How can AD Volume Percent help in market analysis?
As a breadth indicator, AD Volume Percent measures the money flow behind a move. High positive values indicate strong buying pressure, while highly negative values indicate strong selling pressure.
What are the significance of divergences in the AD Volume Line?
Divergences can signal potential trend reversals. For instance, if the Technology SPDR (XLK) moves to a new high but the AD Volume Line doesn't, it may indicate weakening buying pressure and potential for a trend reversal.
Can moving averages be applied to AD Volume Percent?
Yes, applying a moving average to AD Volume Percent can create an oscillator that fluctuates above/below the zero line, similar to a momentum oscillator.
What insights does AD Volume Percent provide over the price of the underlying security?
While the price of the underlying security reflects external happenings, the AD Volume Percent offers insights into internal dynamics, showing what is happening inside a particular group of stocks.
What should traders consider when using AD Volume Percent as an oscillator?
It's important to note that crosses above/below the zero line can lead to whipsaws and potentially misleading signals. Using thresholds slightly above/below the zero line, like +5% or -5%, may provide more reliable signals.
