
|
Table of Contents
Put/Call Ratio
Introduction
The Put/Call Ratio is an indicator that shows put volume relative to call volume. Put options are used to hedge against market weakness or bet on a decline. Call options are used to hedge against market strength or bet on an advance. The Put/Call Ratio is above 1 when put volume exceeds call volume and below 1 when call volume exceeds put volume. Typically, this indicator is used to gauge market sentiment. Sentiment is deemed excessively bearish when the Put/Call Ratio is trading at relatively high levels and excessively bullish when at relatively low levels. Chartists can apply moving averages and other indicators to smooth the data and derive signals.
Calculation
The calculation is straightforward and simple.
Put/Call Ratio = Put Volume / Call Volume
Options Exchanges
StockCharts.com provides Put/Call Ratios from the Chicago Board Options Exchange (CBOE) for analysis. CBOE is the biggest options exchange and the statistics from the CBOE are the most widely followed. The CBOE indicators break down the options into three groups: equity, index and total. The CBOE Equity Put/Call Ratio ($CPCE) focuses on options traded on individual stocks. The CBOE Index Put/Call Ratio ($CPCI) focuses on options traded on the major indices, such as the Dow, Nasdaq, Russell 2000, S&P 500 and S&P 100. Equity and index options are combined in the CBOE Total Put/Call Ratio ($CPC).
Interpretation
As with most sentiment indicators, the Put/Call Ratio is used as a contrarian indicator to gauge bullish and bearish extremes. Contrarians turn bearish when too many traders are bullish and turn bullish when too many traders are bearish. Traders buy puts as insurance against a market decline or as a directional bet. While calls are not used so much for insurance purposes, they are bought as a directional bet on rising prices. Put volume increases when the expectations for a decline increase. Conversely, call volume increases when the expectations for an advance increase. Sentiment reaches extremes when the Put/Call Ratio moves to relatively high or low levels. These extremes are not fixed and can change over time. A Put/Call Ratio at its lower extremities would show excessive bullishness because call volume would be significantly higher than put volume. In contrarian terms, excessive bullishness would argue for caution and the possibility of a stock market decline. A Put/Call Ratio at its upper extremities would show excessive bearishness because put volume would be significantly higher than call volume. Excessive bearishness would argue for optimism and the possibility of a bullish reversal.
Index, Equity or Total
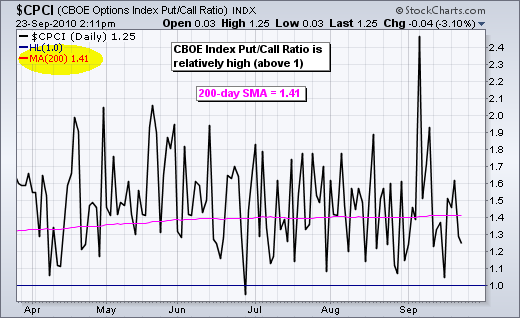
When using the CBOE-based indicators, chartists must choose between equity, index or total option volume. In general, index options are associated with professional traders and equity options are associated with non-professional traders. Even though professionals use index options for hedging or directional bets, puts garner a significant portion of total volume for hedging purposes. The chart below shows the CBOE Index Put/Call Ratio ($CPCI) with the 200-day moving average. Notice that this ratio is consistently above 1 and the 200-day SMA is at 1.41, which indicates a bias towards puts. This bias is because index options (puts) are used to hedge against a market decline.
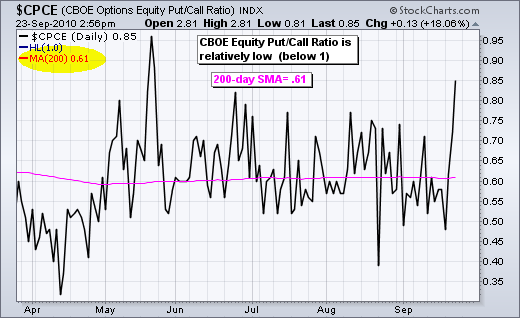
In contrast, the CBOE Equity Put/Call Ratio ($CPCE) stays largely below 1, which indicates a clear bias toward call volume. Notice that the 200-day moving average is at .61, which is well below 1. Non-professional traders are more bullish-oriented, which keeps call volume relatively high.
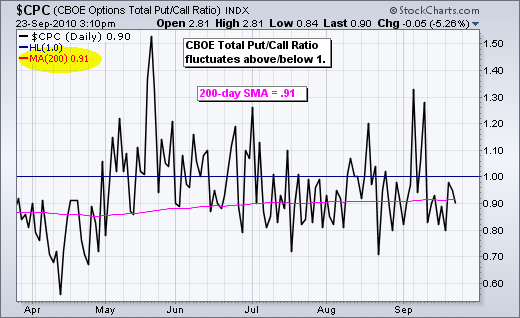
The CBOE Total Put/Call Ratio ($CPC) combines equity and index options to create an oscillator that fluctuates above/below 1. The put bias in index options is offset by the call bias in equity options. The 200-day moving average is still below 1 (.91), which indicates a slight bias towards call volume over the last 200 days. However, the indicator does fluctuate above and below 1, which shows a shifting bias from put volume to call volume.
If equity options reflect retail trader sentiment and index options reflect professional trader sentiment, then the combination reflects “market” sentiment. This means the CBOE Total Put/Call Ratio can be used as a sentiment gauge for the broad market. This article will focus on the CBOE Total Put/Call Ratio. Not because it is necessarily better, but because it represents a good aggregate. Chartists should look at all three to compare the varying degrees of bullishness and bearishness.
Spike Extremes
The CBOE Total Put/Call Ratio can be used to identify spike extremes that may foreshadow a market reversal. A spike extreme occurs when the indicator spikes above or below a certain threshold. The chart below shows the indicator with horizontal lines at 1.20 (green) and .70 (red). A spike above 1.20 reflects a surge in put volume relative to call volume, which could be interpreted as excessive bearishness. As a contrarian indicator, excessive bearishness is viewed as bullish. Too many traders are bearish. The green vertical lines show the spikes and the green arrows match with the S&P 500. Spikes above 1.20 identified tradable lows in late October and early February. Extremes in May and June resulted in shallow bounces or flat trading before the market continued lower. The indicator then spiked above 1.20 after the September low.
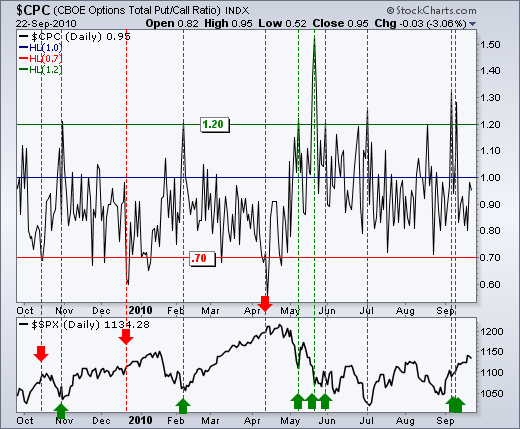
Spikes below .70 reflect a surge in call volume relative to put volume. Calls are bought when participants expect the market to rise. Excessive call volume signals excessive bullishness that can foreshadow a bearish stock market reversal. The red vertical lines mark these spikes, while the red arrows depict the S&P 500 at the time. The October signal worked out well, the December signal was too early and the April signal worked out well.
Smoothing the Ratio
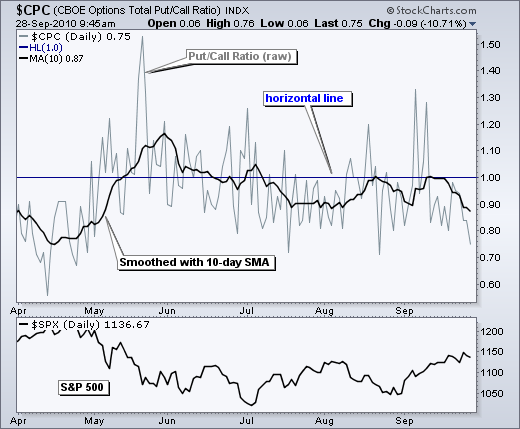
Because the CBOE Total Put/Call Ratio produces a rather choppy series, a short moving average can be applied to smooth the data and define trends. The chart below shows the indicator as a 10-day SMA (pink). The daily values are “invisible” to focus on the 10-day SMA. See the SharpCharts section below for ways to make a plot invisible.
There are a few takeaways from this chart. First, notice that the indicator is much smoother with less volatility. Second, the 10-day SMA can actually trend in one direction for a few weeks. Third, the spike thresholds are set lower because of less volatility. Fourth, the 10-day SMA slows the indicator to produce a lag in the signals.
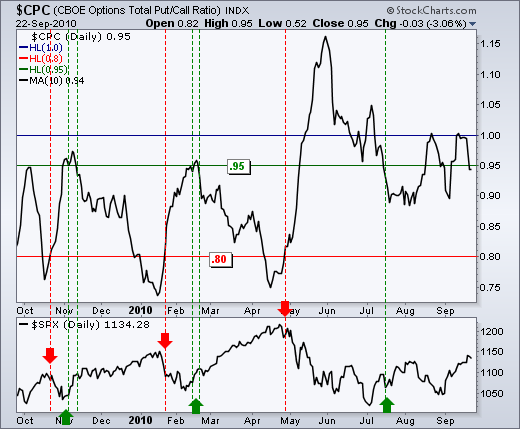
The red and green vertical lines mark the signals with the red and green arrows marking the S&P 500 at signal time. A bullish signal occurs when the indicator moves above the bearish extreme (.95) and the back below. A bearish signal occurs when the indicator moves below the bullish extreme (.80) and back above. Because this moving average can trend for extended periods, it is important to wait for confirmation with a move back above or below the threshold. Waiting for this confirmation would have prevented a long position when the indicator moved above .95 in May. Notice how the indicator kept on moving higher and remained at relatively high levels for an extended period of time.
Shifting Ranges
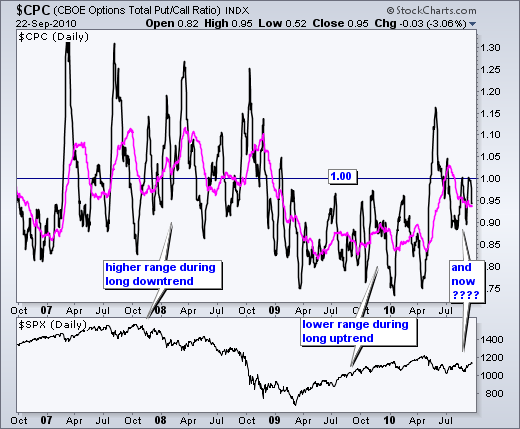
Depending on market conditions, the ranges for the CBOE Total Put/Call Ratio will shift over time. The chart below shows the 10-day SMA (black) and the 50-day SMA (pink). A blue horizontal line is set at 1.00. Notice how the moving averages fluctuated above/below 1.00 from April 2007 until early 2009. This coincided with a flat market in the first half of 2007 and then an extended decline. The relatively elevated levels indicate a bias towards put volume (downside protection or direction bet). As the market reversed in March 2009 and started higher, the CBOE Total Put/Call Ratio moved into a lower range centered around .85, which shows a bias towards call volume. The moving averages stayed in this range until April 2010 and then both shot above 1.00 again.
Conclusions
As a contrarian sentiment indicator, signals from Put/Call Ratio will often be at odds with the prevailing trend. Call volume increases as a rally takes hold, while put volume increases during an extended decline. When the Put/Call Ratio reaches an extreme, it suggests that options players are either excessively bullish or bearish. These contrarian signals can sometimes pick tops and bottoms, but sometimes they will be too early or simply wrong. Indicators are not perfect. It is important to identify the extremes and wait for an extreme to be reached. Most of the time, the Put/Call Ratio will fluctuate between these extremes. It is also important to use the Put/Call Ratio in conjunction with other indicators, such as momentum oscillators or chart patterns to confirm signals. Waiting for a little confirmation can often filter out bad signals.
Put/Call Ratio on StockCharts.com
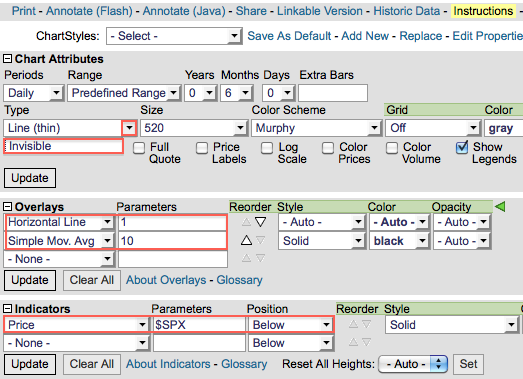
The Put/Call Ratio can be plotted a variety of ways using the SharpCharts charting tool. The indicator can be placed in the main window or above/below the main window. The example below shows the CBOE Total Put/Call Ratio ($CPC) in the main window (gray) with a 10-day SMA for smoothing (black). Users can also choose “Invisible” for chart “Type” to hide the daily values. This will expand the price scale to fit with the smoothed version (10-day SMA). Horizontal lines can also be added as “Overlays.” A corresponding index can be shown as an “Indicator” to compare the Put/Call Ratio to index movements. These chart settings are shown below the chart. Click here for a live example.
Further Study
Larry McMillan is virtually synonymous with options. A “Trader's Hall of Fame” recipient, he first shared his personal options strategies and techniques in the original McMillan on Options. Now in a revised Second Edition, this indispensable guide to the world of options addresses a myriad of new techniques and methods needed for profiting consistently in today's fast-paced investment arena.
| McMillan on Options Larry McMillan |
 |
 |