
|
Table of Contents
Kaufman's Adaptive Moving Average (KAMA)
What Is Kaufman's Adaptive Moving Average?
Developed by Perry Kaufman, Kaufman's Adaptive Moving Average (KAMA) is a moving average designed to account for market noise or volatility. KAMA will closely follow prices when the price swings are relatively small, and the noise is low. KAMA will adjust when the price swings widen and follow prices from a greater distance. This trend-following indicator can identify the overall trend, time turning points and filter price movements.
KAMA Calculation
Formulas
There are several steps required to calculate Kaufman's Adaptive Moving Average. Let's first start with the settings recommended by Perry Kaufman: KAMA(10,2,30).
- 10 is the number of periods for the Efficiency Ratio (ER).
- 2 is the number of periods for the fastest EMA constant.
- 30 is the number of periods for the slowest EMA constant.
Before calculating KAMA, we need to calculate the Efficiency Ratio (ER) and the Smoothing Constant (SC). Breaking down the formula into bite-size nuggets makes it easier to understand the methodology behind the indicator.
Step 1: Efficiency Ratio (ER)
The ER is basically the price change adjusted for the daily volatility.
ER = Change/Volatility

Change = ABS(Close - Close (10 periods ago))

Volatility = Sum10(ABS(Close - Prior Close))

Volatility is the sum of the absolute value of the last ten price changes (Close - Prior Close).
Note: ABS stands for Absolute Value.
In statistical terms, the Efficiency Ratio tells us the fractal efficiency of price changes. ER fluctuates between 1 and 0, but these extremes are the exception, not the norm. ER would be 1 if prices moved up 10 consecutive periods or down 10 consecutive periods. ER would be zero if price is unchanged over the 10 periods.
Step 2: Smoothing Constant (SC)
The smoothing constant uses the ER and two smoothing constants based on an exponential moving average.
SC = [ER x (fastest SC - slowest SC) + slowest SC]2

SC = [ER x (2/(2+1) - 2/(30+1)) + 2/(30+1)]2
As you may have noticed, the Smoothing Constant is using the smoothing constants for an exponential moving average in its formula. (2/30+1) is the smoothing constant for a 30-period EMA. The Fastest SC is the smoothing constant for shorter EMA (2-periods). The slowest SC is the smoothing constant for the slowest EMA (30-periods). Note that the “2” at the end is to square the equation.
Step 3: KAMA
With the Efficiency Ratio (ER) and Smoothing Constant (SC), we are now ready to calculate Kaufman's Adaptive Moving Average (KAMA). Since we need an initial value to start the calculation, the first KAMA is just a simple moving average. The following calculations are based on the formula below.
Current KAMA = Prior KAMA + SC x (Price - Prior KAMA)
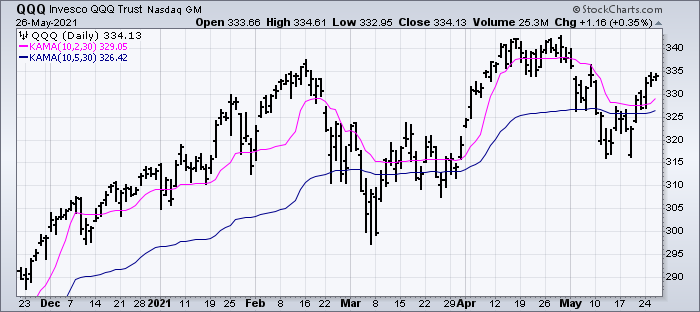
Calculation Example/Chart
The images below show a screenshot from an Excel spreadsheet used to calculate KAMA and the corresponding QQQ chart.


Click here to download this spreadsheet example.
Interpreting KAMA
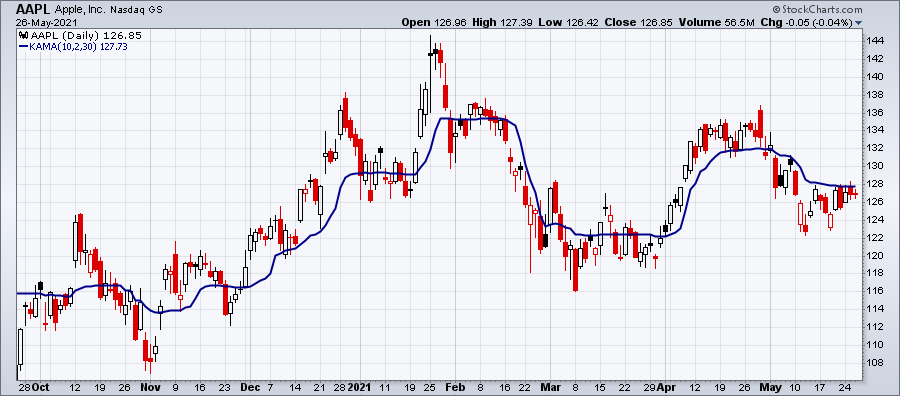
Chartists can use KAMA like any other trend-following indicator, such as a moving average. Chartists can look for price crosses, directional changes and filtered signals.
First, a cross above or below KAMA indicates directional changes in prices. As with any moving average, a simple crossover system will generate lots of signals and lots of whipsaws. Chartists can reduce whipsaws by applying a price or time filter to the crossovers. One might require price to hold the cross for a set number of days or require the cross to exceed KAMA by a set percentage.

Second, chartists can use the direction of KAMA to define the overall trend for a security. This may require a parameter adjustment to smooth the indicator further. Chartists can change the middle parameter, which is the fastest EMA constant, to smooth KAMA and look for directional changes. The trend is down as long as KAMA is falling and forging lower lows. The trend is up as long as KAMA is rising and forging higher highs. The Kroger example below shows KAMA(10,5,30) with a steep uptrend from December to March and a less-steep uptrend from May to August.

Finally, chartists can combine signals and techniques. Chartists can use a longer-term KAMA to define the bigger trend and a shorter-term KAMA for trading signals. For example, KAMA (10,5,30) could be used as a trend filter and be deemed bullish when rising. Once bullish, chartists could then look for bullish crosses when price moves above KAMA (10,2,30). The example below shows MMM with a rising long-term KAMA and bullish crosses in December, January, and February. Long-term KAMA turned down in April and there were bearish crosses in May, June, and July.

Charting with KAMA
The KAMA overlay can be added to SharpCharts and ACP Charts.
Using with SharpCharts
KAMA can be found as an indicator overlay in the SharpCharts workbench. The default settings will automatically appear in the parameter box once it is selected and chartists can change these parameters to suit their analytical needs. The first parameter is for the Efficiency Ratio and chartists should refrain from increasing this number. Instead, chartists can decrease it to increase sensitivity. Chartists looking to smooth KAMA for longer-term trend analysis can increase the middle parameter incrementally. Even though the difference is just 3, KAMA(10,5,30) is significantly smoother than KAMA(10,2,30).
Click here for a live version of the chart.
For more details on the parameters used to configure KAMA overlays, please see our SharpCharts Parameter Reference in the Support Center.
Using with StockChartsACP
This overlay can be added from the Chart Settings panel for your StockChartsACP chart. KAMA can be overlaid on the security's price plot or on an indicator panel.

Click here for a live version of this chart.
By default, the overlay uses 2-period and 30-period EMAs, plus 10 periods for the Efficiency Ratio. These parameters can be adjusted to meet your technical analysis needs.
Scanning for KAMA
StockCharts members can screen for stocks based on KAMA values. Below are some example scans that can be used for KAMA-based signals. Simply copy the scan text and paste it into the Scan Criteria box in the Advanced Scan Workbench.
Members can also set up alerts to notify them when a KAMA-based signal is triggered for a stock. Alerts use the same syntax as scans, so the sample scans below can be used as a starting point for setting up alerts as well. Simply copy the scan text and paste it into the Alert Criteria box in the Technical Alert Workbench.
Overall Uptrend with Price Crossing Above KAMA
This scan starts with stocks that average 100,000 shares daily volume and have an average closing price above 10. An uptrend is present when trading above the longer-term KAMA(10,5,30). A buy signal materializes when price moves above the shorter-term KAMA(10,2,30).
[type = stock] AND [country = US]
AND [Daily SMA(20,Daily Volume) > 100000]
AND [Daily SMA(60,Daily Close) > 10]

AND [KAMA(10,5,30) >  Daily SMA(50,KAMA(10,5,30))]
AND [Daily Close crosses KAMA(10,2,30)]
Overall Downtrend with Price Crossing Below KAMA
This scan starts with stocks that average 100,000 shares daily volume and have an average closing price above 10. A downtrend is present when trading below the longer-term KAMA(10,5,30). A sell signal materializes when price moves below the shorter-term KAMA(10,2,30).
[type = stock] AND [country = US]
AND [Daily SMA(20,Daily Volume) > 100000]
AND [Daily SMA(60,Daily Close) > 10]

AND [KAMA(10,5,30) <  Daily SMA(50,KAMA(10,5,30))]
AND [KAMA(10,2,30) crosses Daily Close]
For more details on the syntax to use for KAMA scans, please see our Scanning Indicator Reference in the Support Center.
Additional Resources
Stocks & Commodities Magazine Articles
Perry Kaufman interview with Thom Hartle
May 1995 - Stocks & Commodities