|
|
Table of Contents
Moving Average Envelopes
Introduction
Moving Average Envelopes are percentage-based envelopes set above and below a moving average. The moving average, which forms the base for this indicator, can be a simple or exponential moving average. Each envelope is then set the same percentage above or below the moving average. This creates parallel bands that follow price action.
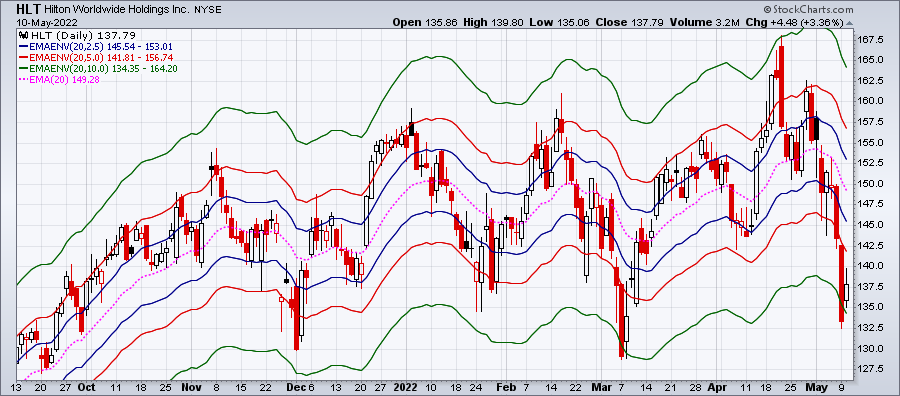
Click here for a live version of this chart.
With a moving average as the base, Moving Average Envelopes can be used as a trend following indicator. Beyond simply trend following, though, the envelopes can also be used to identify overbought and oversold levels when the trend is relatively flat.
Moving Average Envelope Calculation
Formulas
Calculating Moving Average Envelopes is straightforward. First, choose a simple moving average or exponential moving average. Simple moving averages weight each data point (price) equally. Exponential moving averages put more weight on recent prices and have less lag. Second, select the number of time periods for the moving average. Third, set the percentage for the envelopes. A 20-day moving average with a 2.5% envelope would show the following two lines:
Upper Envelope: 20-day SMA + (20-day SMA x .025)
Lower Envelope: 20-day SMA - (20-day SMA x .025)
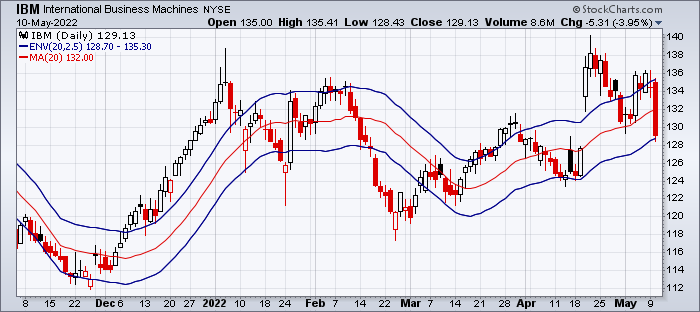
The chart above shows IBM with 20-day SMA envelopes set at 2.5% (blue). Note that the 20-day SMA (red) was added to this SharpChart for reference. Notice how the envelopes move parallel with the 20-day SMA. They remain a constant 2.5% above and below the moving average.
Adjusting the Settings
The parameters for the Moving Average Envelopes depend on your trading/investing objectives and the characteristics of the security involved. Traders will likely use shorter (faster) moving averages and relatively tight envelopes. Investors will likely prefer longer (slower) moving averages with wider envelopes.
A security's volatility will also influence the parameters. Bollinger Bands and Keltner Channels have built-in mechanisms that automatically adjust to a security's volatility. Bollinger Bands use the standard deviation to set bandwidth. Keltner Channels use the Average True Range (ATR) to set channel width. These automatically adjust for volatility. Chartists must independently account for volatility when setting the Moving Average Envelopes. Securities with high volatility will require wider bands to encompass most price action. Securities with low volatility can use narrower bands.
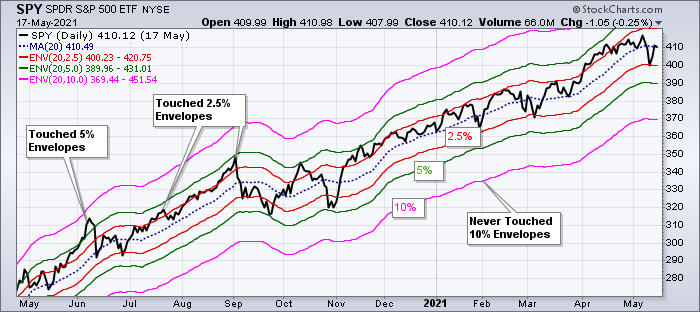
In choosing the right parameters, it often helps to overlay a few different Moving Average Envelopes and compare. The chart above shows the S&P 500 ETF with three Moving Average Envelopes based on the 20-day SMA. The 2.5% envelopes (red) were touched several times, the 5% envelopes (green) were only touched during the July surge. The 10% envelopes (pink) were never touched, which means this band is too wide. A medium-term trader might use the 5% envelopes, while a short-term trader could use the 2.5% envelopes.
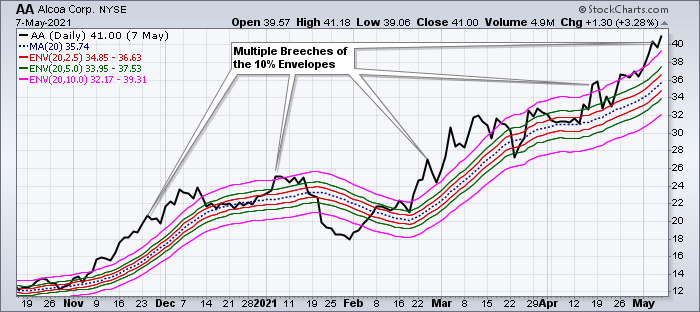
Stock indices and ETFs require tighter envelopes because they are typically less volatile than individual stocks. The Alcoa chart has the same Moving Average Envelopes as the SPY chart. However, notice that Alcoa breached the 10% envelopes numerous times because it is more volatile.
Interpreting Moving Average Envelopes
Indicators based on channels, bands and envelopes are designed to encompass most price action. Therefore, moves above or below the envelopes warrant attention. Trends often start with strong moves in one direction or another. A surge above the upper envelope shows extraordinary strength, while a plunge below the lower envelope shows extraordinary weakness. Such strong moves can signal the end of one trend and the beginning of another.
With a moving average as its foundation, Moving Average Envelopes are a natural trend following indicator. As with moving averages, the envelopes will lag price action. The direction of the moving average dictates the direction of the channel. In general, a downtrend is present when the channel moves lower, while an uptrend exists when the channel moves higher. The trend is flat when the channel moves sideways.
Sometimes a strong trend does not take hold after an envelope break and prices move into a trading range. Such trading ranges are marked by a relatively flat moving average. The envelopes can then be used to identify overbought and oversold levels for trading purposes. A move above the upper envelope denotes an overbought situation, while a move below the lower envelope marks an oversold condition.
Learn More: Moving Averages
Trend Identification
Moving Average Envelopes can be used to identify strong moves that signal the start of an extended trend. The trick, as always, is picking the correct parameters, which takes practice, trial and error. The chart below shows Dow Chemical (DOW) with the Moving Average Envelopes (20,10). Closing prices are used because moving averages are calculated with closing prices. Some chartists prefer bars or candlesticks to utilize the intraday day high and low. Notice how DOW surged above the upper envelope in mid-July and continued moving above this envelope until early August. This shows extraordinary strength. Also, note that the Moving Average Envelopes turned up and followed the advance. After a move from 14 to 23, the stock was clearly overbought. However, this move established a strong precedent that marked the beginning of an extended trend.
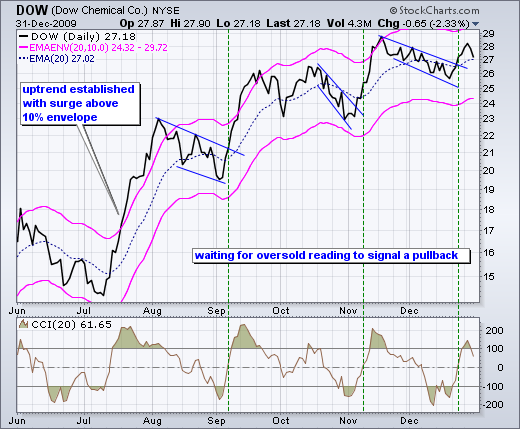
With DOW becoming overbought soon after establishing its uptrend, it was time to wait for a playable pullback. Traders can look for pullbacks with basic chart analysis or with indicators. Pullbacks often come in the form of falling flags or wedges. DOW formed a picture perfect falling flag in August and broke resistance in September. Another flag formed in late October with a breakout in November. After the November surge, the stock pulled back with a five-week flag into December. The Commodity Channel Index (CCI) is shown in the indicator window. Moves below -100 show oversold readings. When the bigger trend is up, oversold readings can be used to identify pullbacks to improve the risk-reward profile for a trade. Momentum turns bullish again when CCI moves back into positive territory (green dotted lines).
The inverse logic can be applied for a downtrend. A strong move below the lower envelope signals extraordinary weakness that can foreshadow an extended downtrend. The chart below shows International Game Tech (IGT) breaking below the 10% envelope to establish a downtrend in late October 2009. Because the stock was quite oversold after this sharp decline, it would have been prudent to wait for a bounce. We can then use basic price analysis or another momentum indicator to identify bounces.
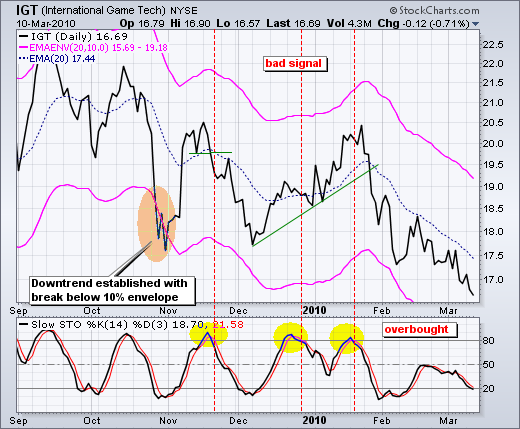
The indicator window shows the Stochastic Oscillator being used to identify overbought bounces. A move above 80 is considered overbought. Once above 80, chartists can then look for a chart signal or a move back below 80 to signal a downturn (red dotted lines). The first signal was confirmed with a support break. The second signal resulted in a whipsaw (loss) because the stock moved above 20 a few weeks later. The third signal was confirmed with a trend line break that resulted in a rather sharp decline.
Overbought/Oversold
Moving Average Envelopes are actually quite similar to the Percent Price Oscillator (PPO), a momentum oscillator which is often used to identify overbought and oversold levels. Moving Average Envelopes tell us when a security is trading a certain percentage above or below a moving average, while the PPO shows the percentage difference between a short EMA and a longer EMA.
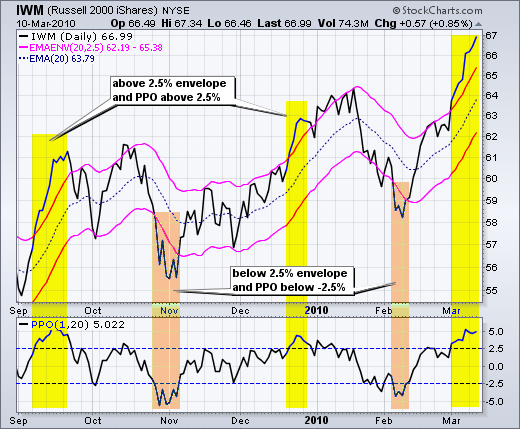
In the example chart above, we can see that the PPO (1,20), which shows the difference between a 1-day EMA (essentially the close) and a 20-day EMA, is giving the exact same signals as the 20-day EMA Envelopes. Notice that prices move above the 2.5% envelope when PPO moves above 2.5% (yellow shading); and prices move below the -2.5% envelope when PPO moves below -2.5% (orange shading).
These PPO moves above or below a specified threshhold can indicate overbought or oversold conditions; by extension, moves above or below the Moving Average Envelopes can be interpreted in the same way. Price moves above the upper envelope line can indicate that a security is overbought; conversely, price moves below the lower envelope line can indicate oversold conditions.
However, measuring overbought and oversold conditions is tricky. Even though one would expect an overbought stock to fall in price, securities can become overbought and remain overbought for some time during a strong uptrend. Similarly, securities in a strong downtrend can become oversold and remain oversold. In a strong uptrend, prices often move above the upper envelope and continue above this line. In fact, the upper envelope will rise as price continues above the upper envelope. Overbought moving average envelope readings can actually be a sign of strength during a strong uptrend. For this reason, overbought and oversold readings are best used when the trend flattens.
The following chart for Nokia has it all. The pink lines represent the Moving Average Envelopes (50,10). A 50-day simple moving average is in the middle (red). The envelopes are set 10% above and below this moving average. The chart starts with an overbought level that stayed overbought as a strong trend emerged in April-May. Price action turned choppy from June to April, which is the perfect scenario for overbought and oversold levels. Overbought levels in September and mid-March foreshadowed reversals. Similarly, oversold levels in August and late October foreshadowed advances. The chart ends with an oversold condition that remains oversold as a strong downtrend emerges.
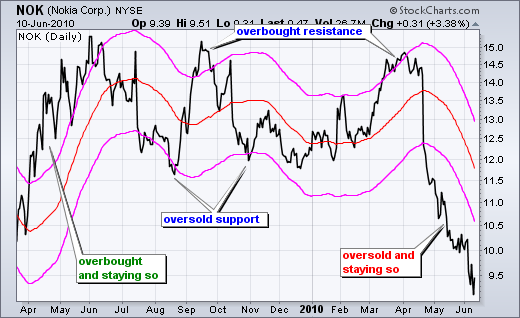
Overbought and oversold conditions should serve as alerts for further analysis. Overbought levels should be confirmed with chart resistance. Chartists can also look for bearish patterns to reinforce reversal potential at overbought levels. Similarly, oversold levels should be confirmed with chart support. Chartist can also look for bullish patterns to reinforce reversal potential at oversold levels.
Learn More: Percent Price Oscillator (PPO)
Conclusion
Moving Average Envelopes are mostly used as a trend following indicator, but can also be used to identify overbought and oversold conditions. After a consolidation period, a strong envelope break can signal the start of an extended trend. Once an uptrend is identified, chartists can turn to momentum indicators and other techniques to identify oversold readers and pullbacks within that trend. Overbought conditions and bounces can be used as selling opportunities within a bigger downtrend.
In the absence of a strong trend, the Moving Average Envelopes can be used like the Percent Price Oscillator. Moves above the upper envelope signal overbought readings, while moves below the lower envelope signal oversold readings. It is also important to incorporate other aspects of technical analysis to confirm overbought and oversold readings. Resistance and bearish reversal patterns can be used to corroborate overbought readings, while support and bullish reversal patterns can be used to affirm oversold conditions.
Charting with Moving Average Envelopes
Moving Average Envelopes can be added to SharpCharts and ACP Charts.
Using with SharpCharts
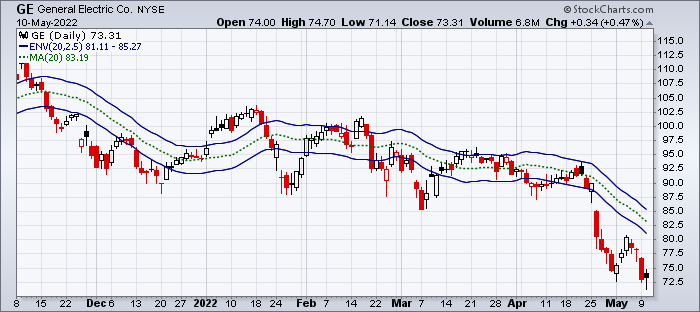
Click here for a live version of this chart.
Moving Average Envelopes can be found in SharpCharts as a price overlay. As with a moving average, the envelopes should be shown on top of a price plot. Upon selecting the indicator from the dropdown box, the default setting will appear in the parameters window (20,2.5). “SMA Envelopes” are based on a simple moving average. “EMA Envelopes” are based on an exponential moving average. The first number (20) sets the periods for the moving average. The second number (2.5) sets the percentage offset. Users can change the parameters to suit their charting needs. The corresponding moving average can be added as a separate overlay, as in the example chart above.

For more details on the parameters used to configure Moving Average Envelope overlays, please see our SharpCharts Parameter Reference in the Support Center.
Using with StockChartsACP
Moving Average Envelopes overlays based on either SMAs or EMAs can be added from the Chart Settings panel for your StockChartsACP chart. They are listed as “EMA Envelopes” and “SMA Envelopes” in the panel. Both types of Moving Average Envelopes can be overlaid on the security's price plot or on an indicator panel.
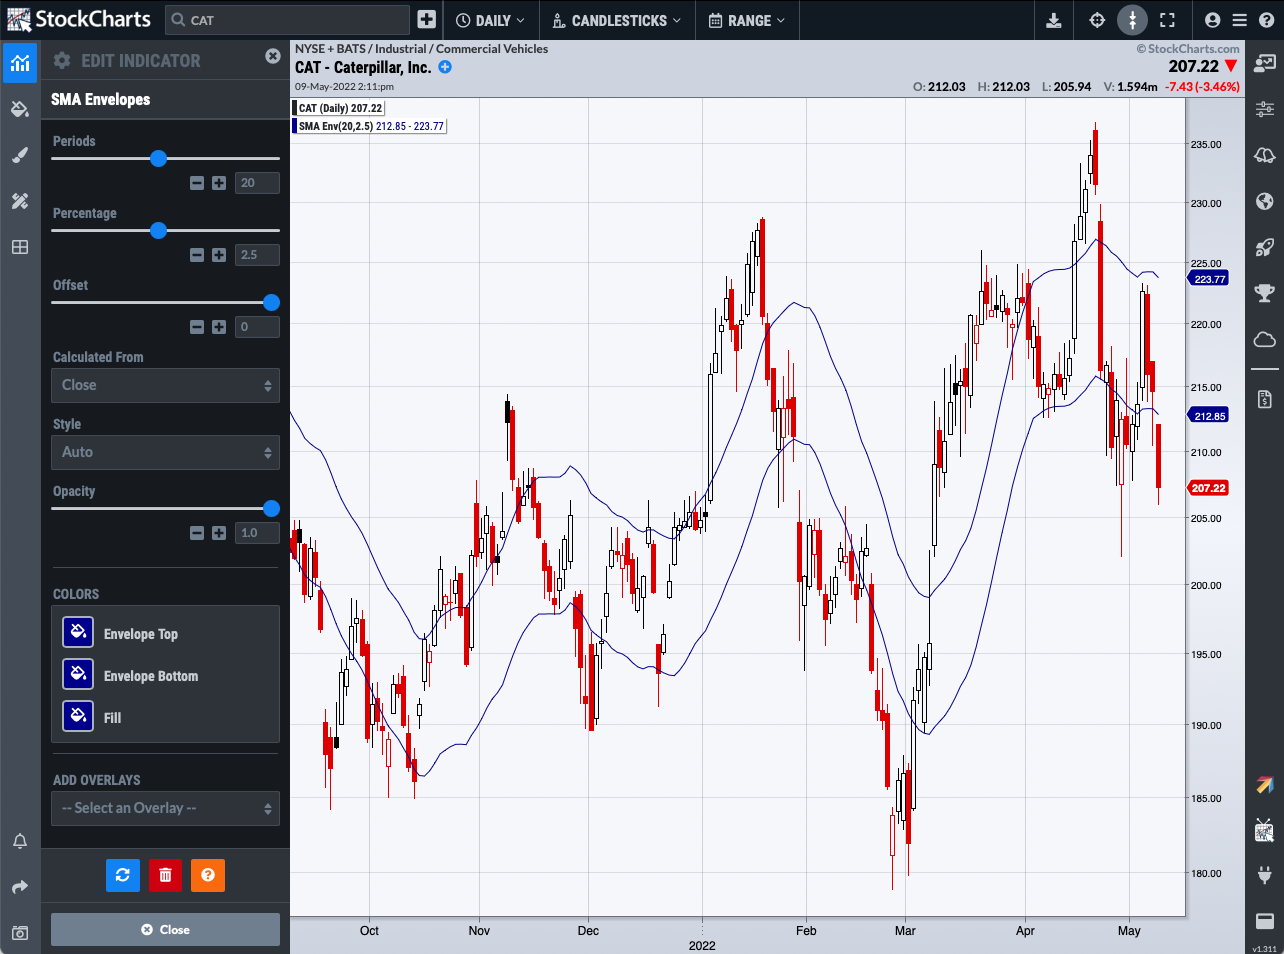
Click here for a live version of this chart.
By default, the overlay uses a 20-period SMA or EMA and sets the bands 2.5 standard deviations above or below the moving average. These parameters can be adjusted to meet your technical analysis needs.
Scanning for Moving Average Envelopes
StockCharts members can screen for stocks based on Moving Average Envelope values. Below are some example scans that can be used for MA Envelope-based signals. Simply copy the scan text and paste it into the Scan Criteria box in the Advanced Scan Workbench.
Members can also set up alerts to notify them when a Moving Average Envelope-based signal is triggered for a stock. Alerts use the same syntax as scans, so the sample scans below can be used as a starting point for setting up alerts as well. Simply copy the scan text and paste it into the Alert Criteria box in the Technical Alert Workbench.
Oversold after Break above Upper Envelope
This scan looks for stocks that broke above their upper exponential Moving Average Envelope (50,10) twenty days ago to affirm or establish an uptrend. The current 10-period CCI is below -100 to indicate a short-term oversold condition.
[type = stock] AND [country = US]
AND [SMA(20,Volume) > 40000]
AND [SMA(60,Close) > 10]

AND [20 days ago Close > 20 days ago Upper MA Env(50,10.0,Close)]
AND [CCI(10) < -100]
Overbought after Break below Lower Envelope
This scan looks for stocks that broke below their lower exponential Moving Average Envelope (50,10) twenty days ago to affirm or establish a downtrend. The current 10-period CCI is above +100 to indicate a short-term overbought condition.
[type = stock] AND [country = US]
AND [SMA(20,Volume) > 40000]
AND [SMA(60,Close) > 10]

AND [20 days ago Close < 20 days ago Lower MA Env(50,10.0,Close)]
AND [CCI(10) > 100]
For more details on the scan syntax to use for Moving Average Envelope scans, please see our Scanning Indicator Reference in the Support Center.
Additional Resources
Recommended Books
Even though Moving Average Envelopes are not used specifically in Thomas Carr's Trend Trading for a Living, the book shows traders how to trade in the direction of the underlying trend. Carr also shows readers how to configure a bullish and bearish watch list from which to set your entry and exit prices.
Michael Covel's Trend Following introduces the fundamental concepts and techniques for a variety of trend following systems. Covel shows why market prices contain all available information, and readers will learn how to interpret price movements and profit from trend following.


