
|
Table of Contents
Harmonic Patterns
Introduction
Chart Pattern recognition is the basic and primary ability any trader develops in Technical Analysis. It may be basic development, but the perfection of pattern recognition takes extensive practice and repetitive exposure. The expert recognition of patterns helps traders to quantify and react to the changing market environment. Chart patterns are categorized into “continuous” and “reversal” patterns, which are further classified as simple and complex patterns. The complex patterns structures may consist of collections of simple patterns and combination of prior swings. The knowledge of this classification of pattern recognition and its properties give traders greater potential to react and adapt to a wider range of trading conditions.
Why Do Patterns Form?
Market prices always exhibit trend, consolidation and re-trend behavior. They rarely reverse their trends and transitional phases to turn from a previous trend on a single bar. During this transitional phase, they experience trading ranges and price fluctuations. This ranging action defines identifiable price patterns. These consolidation phases occasionally favor prevailing trends prior to their formation and continue their direction. These are called “continuation” patterns. Examples of these patterns include Symmetrical Triangle, Flags and Cup and Handle. Some phases result in a reversal of the prior trend and continuing in the new direction. These are called “reversal” patterns. Examples of these patterns include Head and Shoulders, Double Bottoms and Broadening Patterns.
Harmonic Patterns
The concept of Harmonic Patterns was established by H.M. Gartley in 1932. Gartley wrote about a 5-point pattern (known as Gartley) in his book Profits in the Stock Market. Larry Pesavento has improved this pattern with Fibonacci ratios and established rules on how to trade the “Gartley” pattern in his book Fibonacci Ratios with Pattern Recognition. There are few other authors who have worked on this pattern theory, but the best work to my knowledge is done by Scott Carney in his books of “Harmonic Trading.” Scott Carney also invented patterns like “Crab,” “Bat,” “Shark” and “5-0” and added real depth of knowledge for their trading rules, validity and risk/money management.
The primary theory behind harmonic patterns is based on price/time movements which adhere to Fibonacci ratio relationships and its symmetry in markets. Fibonacci ratio analysis works well with any market and on any timeframe chart. The basic idea of using these ratios is to identify key turning points, retracements and extensions along with a series of the swing high and the swing low points. The derived projections and retracements using these swing points (Highs and Lows) will give key price levels for Targets or Stops.
Harmonic patterns construct geometric pattern structures (retracement and projection swings/legs) using Fibonacci sequences. These harmonic structures identified as specified (harmonic) patterns provide unique opportunities for traders, such as potential price movements and key turning or trend reversal points. This factor adds an edge for traders as harmonic patterns attempt to provide highly trustworthy information on price entries, stops and targets information. This may be a key differentiation with other indicators/oscillators and how they work.
Examples of Harmonic Patterns
The Gartley pattern shown below is a 5-point bullish pattern. These patterns resemble “M” or “W” patterns and are defined by 5 key pivot points. Gartley patterns are built by 2 retracement legs and 2 impulse swing legs, forming a 5-point pattern. All of these swings are interrelated and associated with Fibonacci ratios. The center (eye) of the pattern is “B,” which defines the pattern, while “D” is the action or trigger point where trades are taken. The pattern shows trade entry, stop and target levels from the “D” level.

The following chart shows another 5-point harmonic pattern (Butterfly Bearish). This pattern is similar to the above 5-point Gartley pattern, but in reverse. Here the pattern is “W”-shaped with “B” being the center (eye) of the pattern. The pattern shows trade entry, stop and target levels from “D” levels using the “XA” leg.

List of Harmonic Patterns
- ABC Bullish/Bearish
- AB=CD Bullish/Bearish
- 3-Drives Bullish/Bearish
- Gartley Bullish/Bearish
- Butterfly Bullish/Bearish
- Bat Bullish/Bearish
- Crab Bullish/Bearish
- Shark Bullish/Bearish
- Cypher Bullish/Bearish
Fibonacci Discussion
Any discussion on harmonic patterns must include Fibonacci numbers, as these patterns use Fibonacci ratios extensively. Fibonacci numbers are pervasive in the universe and were originally derived by Leonardo Fibonacci. The basic Fibonacci ratio or “Fib ratio” is the Golden Ratio (1.618). Fibonacci numbers are a sequence of numbers where each number is the sum of the previous two numbers.
The series of Fib Numbers begin as follows: 1,1,2,3,5,8,13,21,34,55,89,144,233,317,610….
There are plenty of materials and books about the theory of how these numbers exist in nature and in the financial world. A list of the most important Fib ratios in the financial world, which are derived by squaring, square-rooting and reciprocating the actual Fibonacci sequence, is shown below.
Key set of Fibonacci-derived ratios in trading: 0.382, 0.618, 0.786, 1.0, 1, 1, 2.0, 2.62, 3.62, 4.62
Secondary set of Fibonacci-derived ratios in trading: 0.236, 0.886, 1.13, 2.236, 3.14, 4.236
There are many applications of Fibonacci in technical analysis. Some of the applications include Fibonacci retracements, Fibonacci projections, Fibonacci Fans, Fibonacci Arcs, Fibonacci Time Zones and Fibonacci Price and Time Clusters, among others.
Most trading software packages have Fibonacci drawing tools which can show Fibonacci retracements, extensions and projections. Additionally, Fibonacci numbers can also be applied to “time” and “price” in trading.
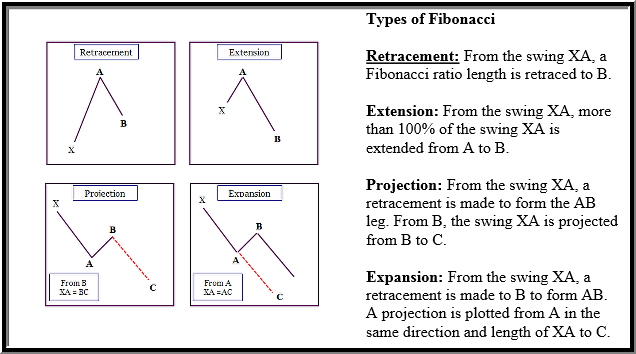
The graphic below illustrates how Fibonacci ratios are used to apply retracement, extension, projection and expansion swings.
Advantages & Disadvantages of Harmonic Patterns
Advantages:
- Provide future projections and stops in advance, making them leading indicators
- Frequent, repeatable, reliable and produce high probable setups
- Trading rules are relatively standardized using Fibonacci ratios
- Work well with defined Market Context, Symmetry and Measured Moves rules
- Work in all timeframes and in all market instruments
- Other indicator theories (CCI, RSI, MACD, DeMark…) can be used along with them
Disadvantages:
- Complex and highly technical, making it difficult to understand
- Correct identification and automation (coding) of harmonic patterns is difficult
- Conflicting Fibonacci retracements/projections can create difficulty in identifying reversal or projection zones
- Complexity arises when opposing patterns form from either the same swings or other swings/timeframes
- Risk/reward factors from non-symmetric and low-ranked patterns are pretty low
How to Trade Harmonic Patterns
Pattern Identification
Harmonic patterns can be a bit hard to spot with the naked eye, but, once a trader understands the pattern structure, they can be relatively easily spotted by Fibonacci tools. The primary harmonic patterns are 5-point (Gartley, Butterfly, Crab, Bat, Shark and Cypher) patterns. These patterns have embedded 3-point (ABC) or 4-point (ABCD) patterns. All the price swings between these points are interrelated and have harmonic ratios based on Fibonacci. Patterns are either forming or have completed “M”- or “W”-shaped structures or combinations of “M” and “W,” in the case of 3-drives. Harmonic patterns (5-point) have a critical origin (X) followed by an impulse wave (XA) followed by a corrective wave to form the “EYE” at (B) completing AB leg. Then followed by a trend wave (BC) and finally completed by a corrective leg (CD). The critical harmonic ratios between these legs determine whether a pattern is a retracement-based or extension-based pattern, as well as its name (Gartley, Butterfly, Crab, Bat, Shark, and Cypher). One of the significant points to remember is that all 5-point and 4-point harmonic patterns have embedded ABC (3-Point) patterns.
All 5-point harmonic patterns (Gartley, Butterfly, Crab, Bat, Shark, Cypher) have similar principles and structures. Though they differ in terms of their leg-length ratios and locations of key nodes (X, A, B, C, D), once you understand one pattern, it will be relatively easy to understand the others. It may help for traders to use an automated pattern recognition software to identify these patterns, rather than using the naked eye to find or force the patterns.
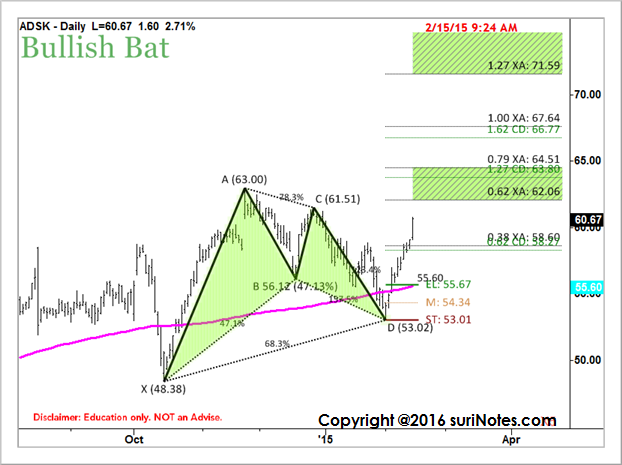
Example: The following chart shows an example of the Bullish Bat pattern with embedded the ABC Bearish pattern. The identification pivots and ratios are marked on the pattern; the pattern also shows the entry, stop and target levels.
Trade Identification
In harmonic pattern setups, a trade is identified when the first 3 legs are completed (in 5-point patterns). For example, in Gartley Bullish pattern, the XA, AB and BC legs are completed and it starts to form the CD leg, you would identify a potential trade may be in the works. Using the projections and retracements of the XA and BC legs, along with the Fibonacci ratios, we can build a price cluster to identify a potential Pattern Completion Zone (PCZ) and D point of the pattern.

Pattern Completion Zone (PCZ)
All harmonic patterns have defined Pattern Completion Zones (PCZ). These PCZs, which are also known as price clusters, are formed by the completed swing (legs) confluence of Fibonacci extensions, retracements and price projections. The patterns generally complete their CD leg in the PCZ, then reverse. Trades are anticipated in this zone and entered on price reversal action.
As an example, the Pattern Completion Zone (PCZ) for the Bullish Gartley pattern is constructed using the following Fibonacci extensions and projections:
0.78 XA
1.27 BC
1.62 BC
AB = CD
Below is an example of idealized Potential Completion Zone (PCZ) formation:

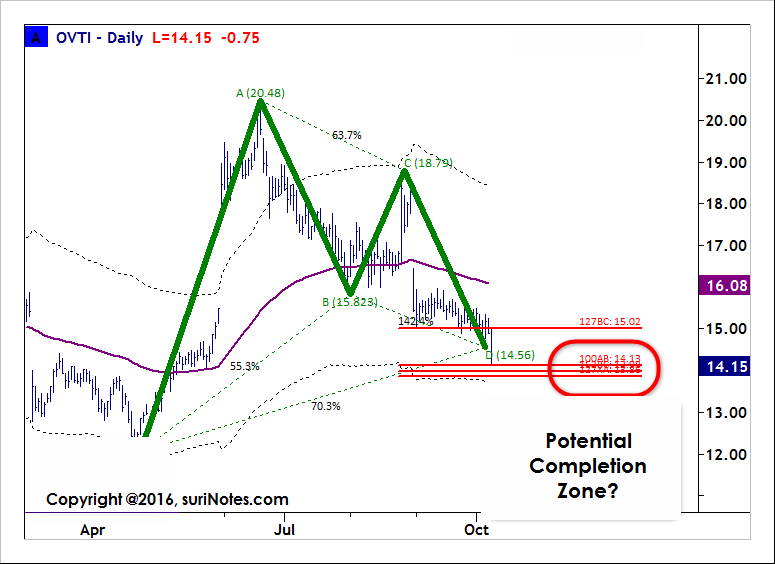
Below is an example of real-world Potential Completion Zone (PCZ) formation:
Market Context Conditions
Most technical traders use chart analysis with market context concepts to trade. Market context concept is described as how current price is reacting to certain levels (pivots, support and resistance, MAs), how indicators are performing relative to historic price conditions (like oversold, overbought) and where/how patterns are developing in the current timeframe or multiple timeframes, etc. Each trader develops his own market context to trade. One of the elegant ways to define market context is through a Fibonacci Grid structure. Fibonacci Grid consists of Fibonacci bands (showing price reaction, trends), pivot levels (to show historic Support/Resistance areas) and Market Structures (to show potential turning points). On any trading chart, Fibonacci Grid layout is plotted to understand how the current price is reacting to the Fibonacci bands and whether the price is exhausted, whether price is trading above/below the extreme bands and whether or not the price is reacting to the support and resistance levels defined by pivots.
The confluence of these levels in the Fibonacci Grid structure, along with emerging pattern structure (and pattern target/stop levels), helps a trader make a good decision. Pattern trading is very precise, as each pattern has specific rules to entry/stop and targets. When combined, harmonic pattern analysis and market context give a great edge to trade. Harmonic patterns can fail, but their failure levels are well-defined and that information is clearly known prior to the trade. Hence, Harmonic pattern trading has many more positives than other trading methods.
Other market context/confirmation conditions and indicators include Divergence, Multiple Timeframes, Fibonacci Bands, Andrew's Pitchfork Analysis, Moving Averages, Pivots, Channels, Trendlines, Volume and Volatility.
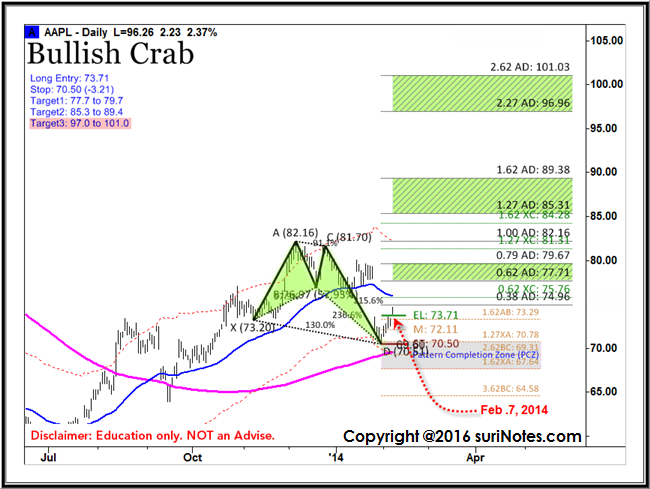
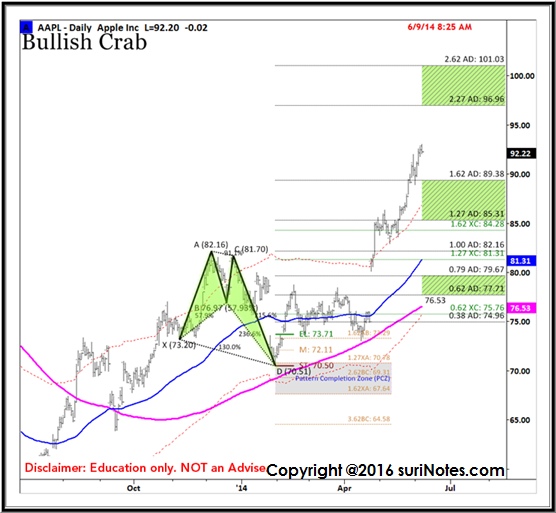
Example: The following example shows how Market Context is used with pattern analysis. This example shows AAPL (date: Feb. 07, 2014) forming a Bullish Crab pattern above 200-SMA and outside the Fibonacci Bands (A, C points) and a D point is formed near the lower Fibonacci Bands with Crab pattern. Also, notice the pattern traded below mid-Fibonacci band level and trading near lower Fibonacci band, signaling a potential exhaustion setup. After completing Bullish Crab setup, price traded above the EL to signal a Long entry to the setup. The overall trend of AAPL is also bullish, as price slope is positive above 200-SMA. On Feb. 07, 2014, a Long bullish trade is entered above 73.71 with a Stop below 70.50 (-3.21). Target levels are 77.7 to 79.7 for the Target Zone1, 85.3 -89.4 for Target Zone2.
The following chart (June 9, 2014) shows AAPL Bullish Crab pattern progression and completion of targets.
Trade Entries and Stops
Trading harmonic patterns with computed entry levels are this author's preference rather than trading them blindly at retracement levels or reversal zones advocated by harmonic trading pundits. Most harmonic traders anticipate the pattern to reverse and attempt to trade these patterns in the “reversal zone” and end up taking contrarian (counter trend) trades. To enter a trade, I prefer a confirmation of reversal price-action combined with a reversal trend change from the “reversal zones.”
Most harmonic pattern trade entries occur around “D” point within the reversal zone. It could be a Buy (in bullish patterns) or a Sell (in bearish patterns). Usually, “D” is identified by a confluence of projections, retracements, and extensions of prior swings (legs), universally called as “reversal zone.” In my view, when prices started to reach this zone, it is signaling an opportunity for potential trade, not a signal to trade yet. The entry criteria and pattern validity are determined by various other factors like current volatility, underlying trend, volume structure within the pattern and market internals etc. If the pattern is valid and the underlying trend and market internals agreeing with the harmonic pattern reversal, then Entry levels (EL) can be calculated using price-ranges, volatility or some combination. Stop is placed above/below the last significant pivot (in 5 and 4-Point patterns it is below D for the bullish pattern, above D for bearish patterns).
Target Zones
Target zones in harmonic patterns are computed based on the retracement, extensions or projections of impulse/corrective swings and Fibonacci ratios from the action point of the pattern structure. For example, in Gartley bullish pattern, the target zones are computed using the XA leg from the trade action point (D). The projections are computed using Fibonacci ratios like 62% or 78.6% of the XA leg and added to the action point (D). The extension ratios like 1., 1.27, 1.62, 2., 2.27 or 2.62 are computed for potential target levels. The primary target zones are computed from D, with 62%-78.6% of the XA leg as the first target zone and 127%-162% as the second target zone.
Target Zone1: (D + XA*0.62) to (D+XA*.786)
Target Zone2: (D + XA*1.27) to (D+XA*1.62)
It is important to note that potential target zones in harmonic patterns are computed from a probability standpoint, not with absolute certainty. Strong money and risk management rules and full working knowledge of the pattern are necessary for any pattern trading success.
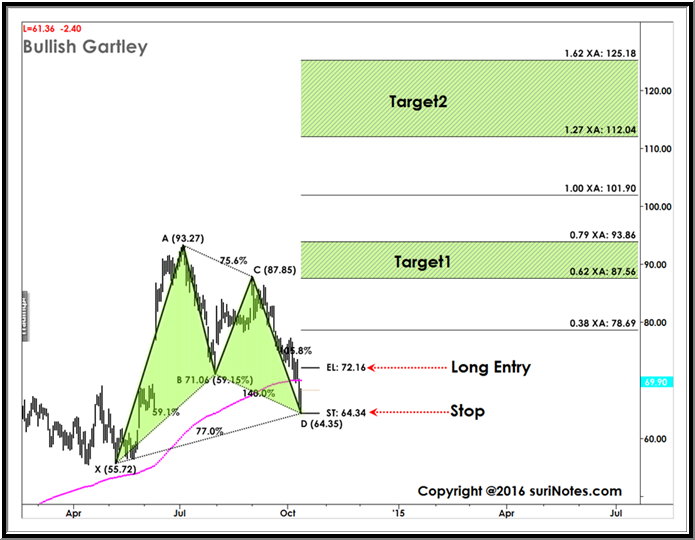
Example: The following chart shows a Bullish Gartley Pattern with an entry level, stops and target zones. The target zones are projected using XA swing length and Fibonacci ratios from D. Target Zone 1 comprises the range of 62%-79%, while Target Zone 2 runs from 127% to 162%.
About the Author
This article was written by Suri Duddella, a private trader who uses proprietary mathematical and algorithmic models and pattern recognition methods. For more information about Suri or to follow his work, visit SuriNotes.com or click here.