|
|
Table of Contents
Falling Wedge
What is a Falling Wedge Pattern?
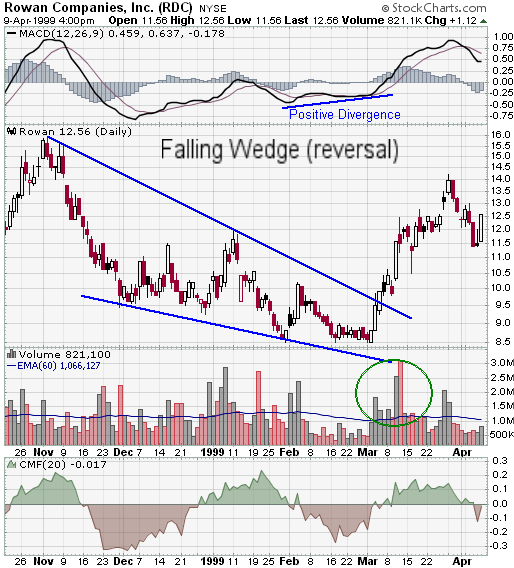
The Falling Wedge is a bullish pattern that begins wide at the top and contracts as prices move lower. This price action forms a cone that slopes down as the reaction highs and reaction lows converge. In contrast to symmetrical triangles, which have no definitive slope and no bias, falling wedges definitely slope down and have a bullish bias. However, this bullish bias can only be realized once a resistance breakout occurs.
Is the Falling Wedge a Reversal or Continuation Pattern?
While this article will focus on the falling wedge as a reversal pattern, it can also fit into the continuation category. As a continuation pattern, the falling wedge will still slope down, but the slope will be against the prevailing uptrend. As a reversal pattern, the falling wedge slopes down and with the prevailing trend. Regardless of the type (reversal or continuation), falling wedges are regarded as bullish patterns.

What Are the Characteristics of a Falling Wedge?
For a pattern to be considered a falling wedge, the following characteristics must be met.
- Prior Trend. To qualify as a reversal pattern, there must be a prior trend to reverse. Ideally, the falling wedge will form after an extended downtrend and mark the final low. The pattern usually forms over a three to six month period, and the preceding downtrend should be at least three months old.
- Upper Resistance Line. It takes at least two reaction highs to form the upper resistance line, ideally three. Each reaction high should be lower than the previous highs.
- Lower Support Line. At least two reaction lows are required to form the lower support line. Each reaction low should be lower than the previous lows.
- Contraction. The upper resistance line and lower support line converge to form a cone as the pattern matures. The reaction lows penetrate the previous lows, but this penetration becomes shallower. Shallower lows indicate a decrease in selling pressure and create a lower support line with a less negative slope than the upper resistance line.
- Resistance Break. Bullish confirmation of the pattern is established once the resistance line is broken in a convincing fashion. It's sometimes prudent to wait for a break above the previous reaction high for further confirmation. Once resistance is broken, there can sometimes be a correction to test the newfound support level.
- Volume. While volume isn't particularly important on rising wedges, it's an essential ingredient to confirm a falling wedge breakout. Without volume expansion, the breakout will lack conviction and be vulnerable to failure.
Like rising wedges, the falling wedge can be one of the most difficult chart patterns to accurately recognize and trade. When lower highs and lower lows form, as in a falling wedge, the security is trending lower. The falling wedge indicates a decrease in downside momentum and alerts investors and traders to a potential trend reversal. Even though selling pressure may diminish, demand wins out only when resistance is broken. As with most patterns, it's important to wait for a breakout and combine other aspects of technical analysis to confirm signals.

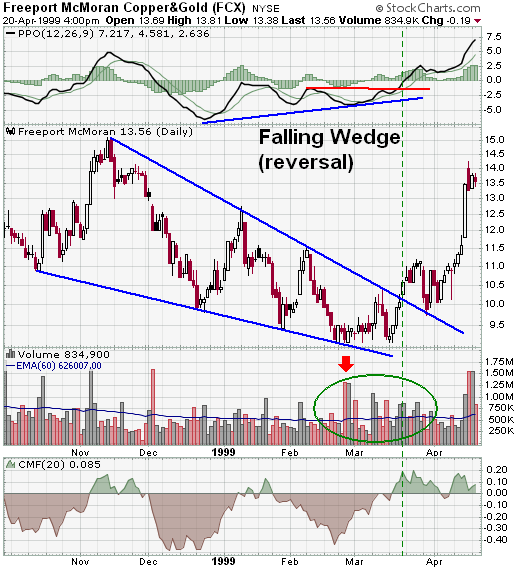
FCX provides a textbook example of a falling wedge at the end of a long downtrend.
- Prior Trend. The downtrend for FCX began in the third quarter of 1997. There was a brief advance in Mar-98, but the downtrend resumed, and the stock was trading at new lows by Feb-99.
- Upper Resistance Line. The upper resistance line formed with four successively lower peaks.
- Lower Support Line. The lower support line formed with four successive lower lows.
- Contraction. The upper resistance line and lower support line converged as the pattern matured. Even though each low is lower than the previous low, these lows are only slightly lower. The shallowness of the new lows indicates that demand is stepping almost immediately after a new low is recorded. The supply overhang remains, but the slope of the upper resistance line is more negative than the lower support line.
- Resistance Break. In contrast to the three previous lows, the late February low was flat and consolidated just above 9 for a few weeks. The subsequent breakout in March occurred with a series of strong advances. In addition, there was a positive divergence in the PPO.
- Volume. After the large volume decline on 24-Feb (red arrow), upside volume began to increase. Above-average volume continued on advancing days and when the stock broke trend line resistance. Money flows confirmed the strength by surpassing their Nov-98 high and moving to their highest level since Apr-98.
- After the trend line breakout, there was a brief pullback to support from the trend line extension. The stock consolidated for a few weeks and then advanced further on increased volume again.
The Bottom Line
The Falling Wedge is a bullish pattern that suggests potential upward price movement. This pattern, while sloping downward, signals a likely trend reversal or continuation, marking a potential inflection point in trading strategies. Falling wedges can develop over several months, culminating in a bullish breakout when prices convincingly exceed the upper resistance line, ideally with a strong increase in trading volume.
The Falling Wedge can be a valuable tool in your trading arsenal, offering valuable insights into potential bullish reversals or continuations. Because of its nuances and complexity, however, it's important for you to have a good understanding of this pattern in order to effectively leverage it in a live trading environment.
Falling Wedge FAQs
How can I tell whether a Falling Wedge is a reversal or a continuation pattern?
The Falling Wedge can signify both a reversal and a continuation pattern. In the context of a reversal pattern, it suggests an upcoming reversal of a preceding downtrend, marking the final low. As a continuation pattern, it slopes down against the prevailing uptrend, implying that the uptrend will continue after a brief period of consolidation or pullback.
How do I know when the bullish confirmation of a Falling Wedge pattern is realized?
The bullish confirmation of a Falling Wedge pattern is realized when the resistance line is convincingly broken, often accompanied by increased trading volume. It's usually prudent to wait for a break above the previous reaction high for further confirmation. Following a resistance break, a correction to test the newfound support level can sometimes occur.
Why is volume important in confirming a Falling Wedge breakout?
Volume is an essential ingredient in confirming a Falling Wedge breakout because it demonstrates market conviction behind the price movement. Without volume expansion, the breakout may lack conviction and be susceptible to failure.
How can I accurately trade a Falling Wedge pattern?
Trading a Falling Wedge pattern accurately can be challenging. It involves recognizing lower highs and lower lows while a security is in a downtrend. The aim is to identify a slowdown in the rate at which prices drop, suggesting a potential shift in trend direction. It's also critical to wait for prices to break through the upper resistance line of the pattern and to validate this bullish signal with other technical analysis tools before deciding to buy.
How long should the preceding downtrend be for a Falling Wedge to qualify as a reversal pattern?
To qualify as a reversal pattern, a Falling Wedge should ideally form after an extended downtrend that's at least three months old. The Falling Wedge pattern itself can form over a three to six-month period.
