|
|
Table of Contents
Andrews' Pitchfork
Introduction
Developed by Alan Andrews, Andrews' Pitchfork is a trend channel tool consisting of three lines; a median trend line in the center with two parallel equidistant trend lines on either side. These lines are drawn by selecting three points, usually based on reaction highs or lows moving from left to right on the chart. As with normal trend lines and channels, the outside trend lines mark potential support and resistance areas. A trend remains in place as long as the Pitchfork channel holds; reversals occur when prices break out of a Pitchfork channel.
Picking Three Points
The first step to using Andrews' Pitchfork is selecting three points for drawing the trend lines. These points are usually based on reaction highs or reaction lows, also referred to as pivot points. Chart 1 shows McKesson (MCK) with Andrews' Pitchfork extending up from the June low. The first point selected marks the start of the median line. Points 2 and 3 define the width of the Pitchfork channel. The median line is based on two points: point 1 and the midpoint between points 2 and 3. As such, the median line starts at point 1 and bisects points 2 and 3. This controls the slope (steepness) of the median line. The outside trend lines are then extended parallel to the median line. The red Andrews' Pitchfork shows an alternative median line based on the July low for point 1. Notice that the red median line still bisects the line between points 2 and 3, but it is steeper than the blue median line. Pitchfork slope depends on the placement of point 1.
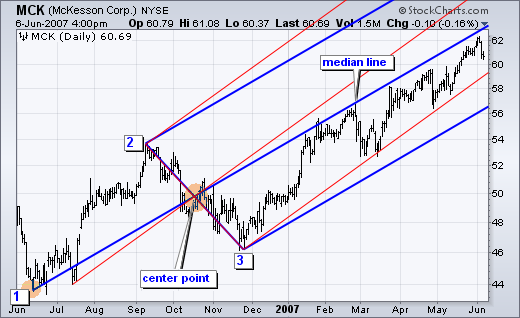
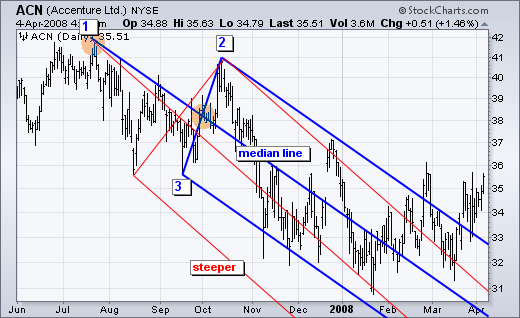
Chart 2 shows a downward sloping Andrews' Pitchfork with Accenture (ACN). The blue median line starts at point 1 and bisects the line between points 2 and 3. The outside trend lines are parallel and equidistant from the median line. For slope reference, the red Pitchfork uses the August low as point 1, which makes the median line steeper.
Flexibility with Point 1
Sometimes the median line needs adjusting to establish a realistic slope. Pitchforks that are too steep will be easily broken. Pitchforks that are too flat will not capture the trend. Chart 3 shows Electronic Arts (ERTS) with Andrews' Pitchfork extending up from the late January low. Ideally, point 1 would be based on the low for the move. Points 2 and 3 would mark the first reaction high and first reaction low after point 1. However, a median line based on the late January low coincides with support in March (green arrows) and resistance in July. More importantly, it creates a channel that contains price action for many months. Notice that ERTS became overbought when prices moved above the upper trend line of the Pitchfork. The trend fully reversed with the break below the lower trend line.
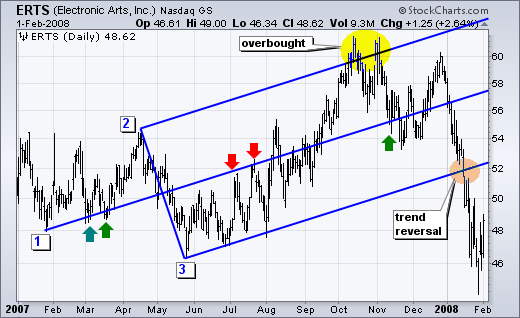
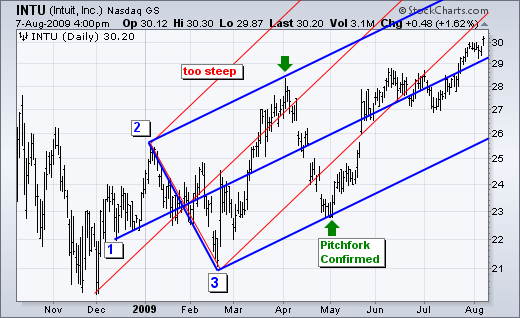
Chart 4 shows Intuit (INTU) with two possible Pitchforks. The red Pitchfork was too steep. Notice that the trend did not reverse when prices moved below the lower trend line in late April. The alternative was to base the median line on the mid-December low. This creates a flatter Pitchfork that is more realistic for an uptrend. As with normal trend lines, steep trend lines are more easily broken. The validity of the blue Pitchfork was confirmed when prices hit resistance at the upper trend line in early April and found support at the lower trend line in early May.
Support, Resistance & Reversal
Pitchfork trend lines can provide support or resistance. In an uptrend, the lower trend line acts as support to define the overall trend, the upper trend line acts as resistance and the median line defines the strength of the trend. Prices should reach the median line on a regular basis during an uptrend. Failure to reach this line shows underlying weakness that could foreshadow a trend reversal. Chart 5 shows Ciena (CIEN) moving higher within a rising Pitchfork. Notice how the lower trend line offers support and the median line offers resistance. Even though Ciena met resistance at the median line throughout the uptrend, it managed to reach this line on a regular basis to affirm the uptrend. Failure to reach the median line would have shown underlying weakness. CIEN broke the lower trend line with a sharp decline in November. Notice that this break held as the trend line then turned into resistance.
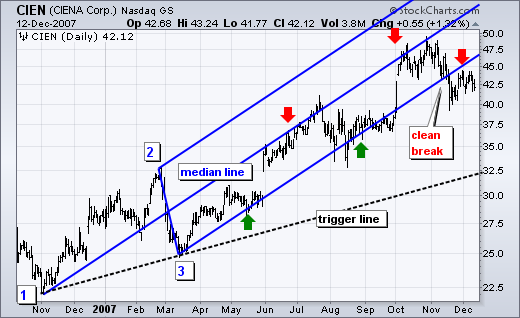
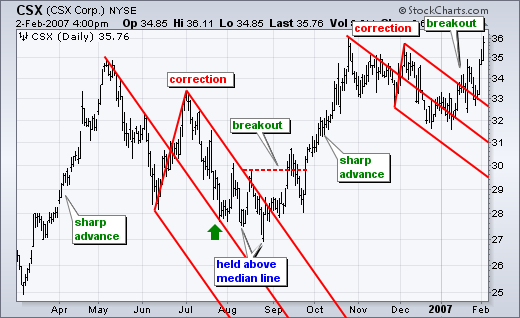
Chart 6 shows CSX Corp (CSX) with a pair of corrections identified by Andrews' Pitchfork. Notice that both corrections formed after sharp advances. For the first correction, it was possible to draw Andrews' Pitchfork after the early July high. Notice that prices did not break the median line in late July. Also, notice that prices held above the median line in August. This showed strength that led to a breakout in September. It was possible to draw the second correction after the early December high. Prices did move below the median line, but soon recovered and CSX broke resistance with a surge in January.
Trigger Lines
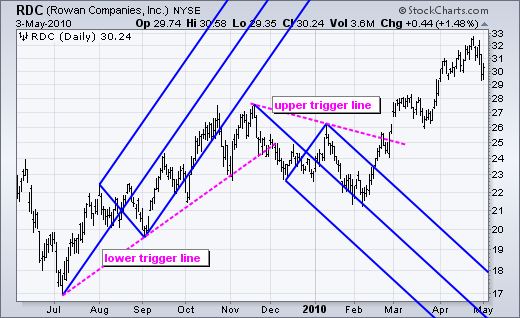
Andrews' Pitchfork also incorporates the use of trigger lines, which are essentially trend lines that originate at point 1. Upper trigger lines extend down from point 1 through the peak at point 3. A break above the upper trigger line is a buy signal. Lower trigger lines extend up from point 1 through the trough of point 2. A break below the lower trigger line acts as a sell signal. Chart 7 shows Rowan Companies (RDC) with a lower trigger line extending up from the July low and an upper trigger line extending down from the November high. These trigger lines are similar to normal trend lines drawn off two reaction highs or reaction lows. Signals from normal trend lines are usually generated much later than the signals generated by Pitchfork breaks.
Conclusion
The steepness of the Pitchfork channel depends on the placement of the three drawing points, particularly point 1, which is the start of the median line. Even though point one usually starts with a reaction high or low, it is sometimes necessary to adjust point 1 to ensure a realistic price channel. Unfortunately, there are no hard rules for point placement. Instead, chartists must use judgment and experience when drawing channels. This is where the subjective nature of technical analysis comes into play. As with most aspects of technical analysis, it is important to build experience by experimenting with Andrews' Pitchfork. Seeing what does or doesn't work firsthand is the only real way to master an indicator.
Using with SharpCharts
You can use our ChartNotes annotation tool to add Andrews' Pitchforks to your charts. Below, you'll find an example of a chart annotated with an Andrews' Pitchfork.
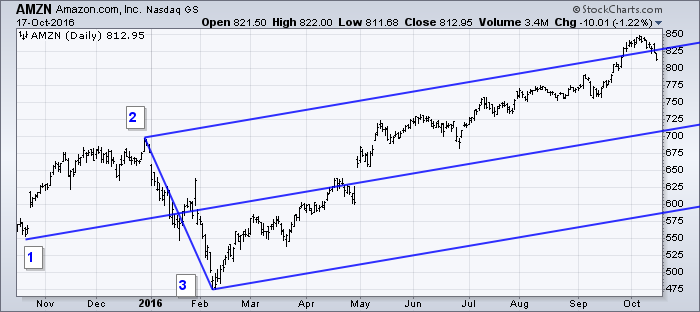
To learn more about how to add this annotation to your charts, check out our Support Center article on ChartNotes' Line Study Tools.
Additional Resources
Stocks & Commodities Magazine Articles
Support & Resistance with the Andrews Pitchfork by Barbara Star
Oct 1995 - Stocks & Commodities
