|
|
Table of Contents
Candlestick Bullish Reversal Patterns
What Is a Bullish Reversal Candlestick Pattern?
A bullish reversal candlestick pattern signals a potential change from a downtrend to an uptrend. It's a hint that the market's sentiment might be shifting from selling to buying.
Important Bullish Reversal Candlestick Patterns to Know
There are dozens of bullish reversal candlestick patterns. We have elected to narrow the field by selecting the most popular for detailed explanations. Below are some of the key bullish reversal patterns with the number of candlesticks required in parentheses.
- Piercing Pattern (2)
- Bullish Harami (2)
- Hammer (1)
- Inverted Hammer (1)
- Morning Star (3)
The hammer and inverted hammer were covered in the article Introduction to Candlesticks. This article will focus on the other six patterns. For a complete list of bullish (and bearish) reversal patterns, see Greg Morris' book, Candlestick Charting Explained.
Before moving on to individual patterns, certain guidelines should be established:
- Most patterns require bullish confirmation.
- Bullish reversal patterns should form within a downtrend.
- Other aspects of technical analysis should be used as well.
How Do You Confirm a Bullish Reversal?
Patterns can form with one or more candlesticks; most require bullish confirmation. The actual reversal indicates that buyers overcame prior selling pressure, but it remains unclear whether new buyers will bid prices higher. Without confirmation, these patterns would be considered neutral and merely indicate a potential support level at best. Bullish confirmation means further upside follow through and can come as a gap up, long white candlestick or high volume advance. Because candlestick patterns are short-term and usually effective for only 1 or 2 weeks, bullish confirmation should come within 1 to 3 days after the pattern.
There Must Be an Existing Downtrend to Reverse
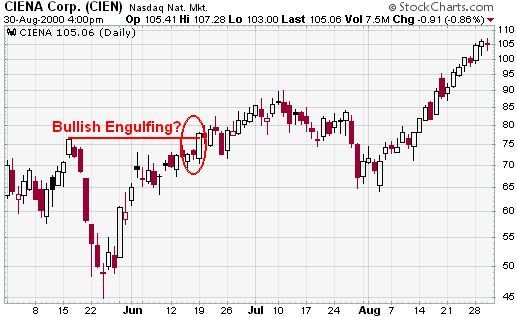
To be considered a bullish reversal, there should be an existing downtrend to reverse. A bullish engulfing at new highs can hardly be considered a bullish reversal pattern. Such formations would indicate continued buying pressure and could be considered a continuation pattern. In the Ciena example below, the pattern in the red oval looks like a bullish engulfing, but formed near resistance after about a 30 point advance. The pattern does show strength, but is more likely a continuation at this point than a reversal pattern.
The existence of a downtrend can be determined by using moving averages, peak/trough analysis or trend lines. A security could be deemed in a downtrend based on one of the following:
- The security is trading below its 20-day exponential moving average (EMA).
- Each reaction peak and trough is lower than the previous.
- The security is trading below its trend line.
These are just examples of possible guidelines to determine a downtrend. Some traders may prefer shorter downtrends and consider securities below the 10-day EMA. Defining criteria will depend on your trading style and personal preferences.
Key Bullish Reversal Candlestick Patterns
Bullish Engulfing
The bullish engulfing pattern consists of two candlesticks, the first black and the second white. The size of the black candlestick is not that important, but it should not be a doji which would be relatively easy to engulf. The second should be a long white candlestick – the bigger it is, the more bullish. The white body must totally engulf the body of the first black candlestick. Ideally, though not necessarily, the white body would engulf the shadows as well. Although shadows are permitted, they are usually small or nonexistent on both candlesticks.
After a decline, the second white candlestick begins to form when selling pressure causes the security to open below the previous close. Buyers step in after the open and push prices above the previous open for a strong finish and potential short-term reversal. Generally, the larger the white candlestick and the greater the engulfing, the more bullish the reversal. Further strength is required to provide bullish confirmation of this reversal pattern.
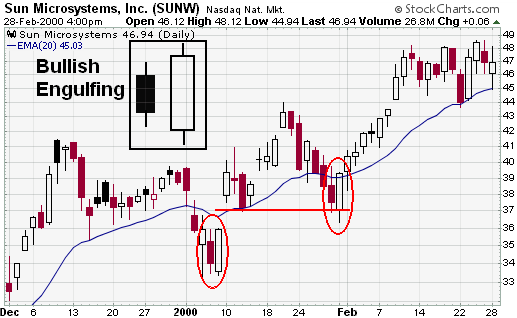
In Jan-00, Sun Microsystems (SUNW) formed a pair of bullish engulfing patterns that foreshadowed two significant advances. The first formed in early January after a sharp decline that took the stock well below its 20-day exponential moving average (EMA). An immediate gap up confirmed the pattern as bullish and the stock raced ahead to the mid-forties. After correcting to support, the second bullish engulfing pattern formed in late January. The stock declined below its 20-day EMA and found support from its earlier gap up. This also marked a 2/3 correction of the prior advance. A bullish engulfing pattern formed and was confirmed the next day with a strong follow-up advance.
Note: The Bullish Engulfing candlestick pattern is similar to the outside reversal chart pattern, but does not require the entire range (high and low) to be engulfed, just the open and close.
Piercing Pattern
The piercing pattern is made up of two candlesticks, the first black and the second white. Both candlesticks should have fairly large bodies and the shadows are usually, but not necessarily, small or nonexistent. The white candlestick must open below the previous close and close above the midpoint of the black candlestick's body. A close below the midpoint might qualify as a reversal, but would not be considered as bullish.
Just as with the bullish engulfing pattern, selling pressure forces the security to open below the previous close, indicating that sellers still have the upper hand on the open. However, buyers step in after the open to push the security higher and it closes above the midpoint of the previous black candlestick's body. Further strength is required to provide bullish confirmation of this reversal pattern.
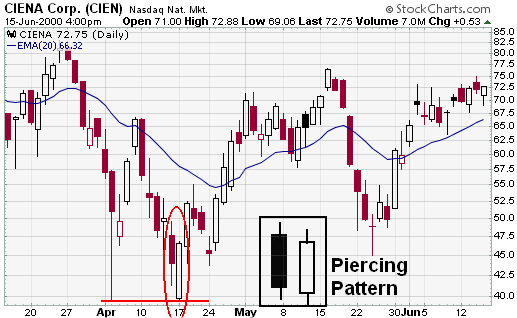
In late March and early April 2000, Ciena (CIEN) declined from above 80 to around 40. The stock first touched 40 in early April with a long lower shadow. After a bounce, the stock tested support around 40 again in mid-April and formed a piercing pattern. The piercing pattern was confirmed the next day with a strong advance above 50. Even though there was a setback after confirmation, the stock remained above support and advanced above 70. Also, note the morning doji star in late May.
Bullish Harami
The bullish harami is made up of two candlesticks. The first has a large body, while the second has a small body that is totally encompassed by the first. There are four possible combinations: white/white, white/black, black/white and black/black. Whether they are bullish reversal or bearish reversal patterns, all harami look the same. Their bullish or bearish nature depends on the preceding trend. Harami are considered potential bullish reversals after a decline and potential bearish reversals after an advance. No matter what the color of the first candlestick, the smaller the body of the second candlestick is, the more likely the reversal. If the small candlestick is a doji, the chances of a reversal increase.
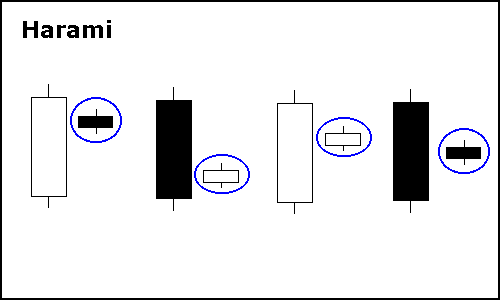
In his book Beyond Candlesticks, Steve Nison asserts that any combination of colors can form a harami, but that the most bullish are those that form with a white/black or white/white combination. Because the first candlestick has a large body, it implies that the bullish reversal pattern would be stronger if this body were white. The long white candlestick shows a sudden and sustained resurgence of buying pressure. The small candlestick afterwards indicates consolidation. White/white and white/black bullish harami are likely to occur less often than black/black or black/white.
After a decline, a black/black or black/white combination can still be regarded as a bullish harami. The first long black candlestick signals that significant selling pressure remains, which could indicate capitulation. The small candlestick immediately following forms with a gap up on the open, indicating a sudden increase in buying pressure and potential reversal.
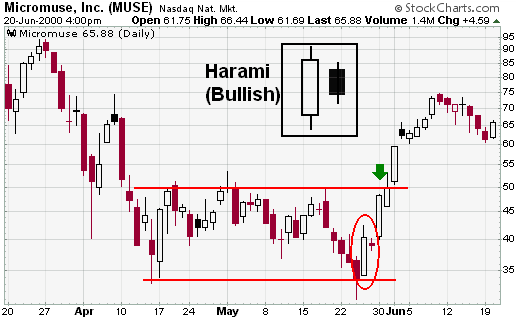
Micromuse (MUSE) declined to the mid-sixties in Apr-00 and began to trade in a range bound by 33 and 50 over the next few weeks. After a 6-day decline back to support in late May, a bullish harami (red oval) formed. The first day formed a long white candlestick, while the second formed a small black candlestick that could be classified as a doji. The next day's advance provided bullish confirmation and the stock subsequently rose to around 75.
Hammer
The hammer is made up of one candlestick, white or black, with a small body, long lower shadow and small or nonexistent upper shadow. The size of the lower shadow should be at least twice the length of the body and the high/low range should be large relative to range over the last 10-20 days.
After a decline, the hammer's intraday low indicates that selling pressure remains. However, the strong close shows that buyers are starting to become active again. Further strength is required to provide bullish confirmation of this reversal pattern.
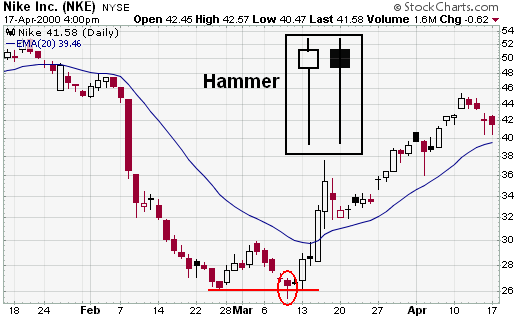
Nike (NKE) declined from the low fifties to the mid-thirties before starting to find support in late February. After a small reaction rally, the stock declined back to support in mid-March and formed a hammer. Bullish confirmation came two days later with a sharp advance.
Morning Star
The morning star consists of three candlesticks:
- A long black candlestick.
- A small white or black candlestick that gaps below the close of the previous candlestick. This candlestick can also be a doji, in which case the pattern would be a morning doji star.
- A long white candlestick.
The black candlestick confirms that the decline remains in force and selling dominates. When the second candlestick gaps down, it provides further evidence of selling pressure. However, the decline ceases or slows significantly after the gap and a small candlestick forms. The small candlestick indicates indecision and a possible reversal of trend. If the small candlestick is a doji, the chances of a reversal increase. The third long white candlestick provides bullish confirmation of the reversal.
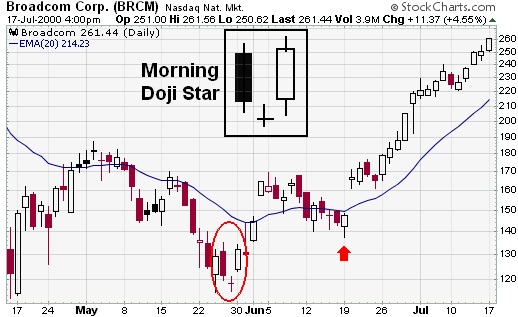
After declining from above 180 to below 120, Broadcom (BRCM) formed a morning doji star and subsequently advanced above 160 in the next three days. These are strong reversal patterns and do not require further bullish confirmation, beyond the long white candlestick on the third day. After the advance above 160, a two-week pullback followed and the stock formed a piecing pattern (red arrow) that was confirmed with a large gap up.
Bullish Abandoned Baby
The bullish abandoned baby resembles the morning doji star and also consists of three candlesticks:
- A long black candlestick.
- A doji that gaps below the low of the previous candlestick.
- A long white candlestick that gaps above the high of the doji.
The main difference between the morning doji star and the bullish abandoned baby are the gaps on either side of the doji. The first gap down signals that selling pressure remains strong. However, selling pressure eases and the security closes at or near the open, creating a doji. Following the doji, the gap up and long white candlestick indicate strong buying pressure and the reversal is complete. Further bullish confirmation is not required.
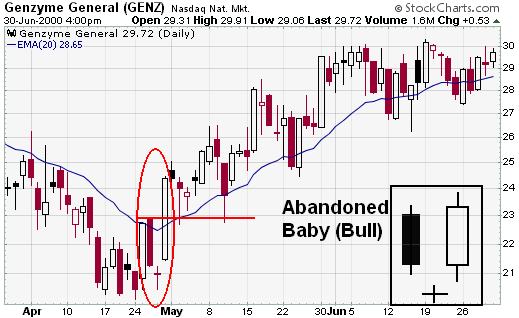
In April, Genzyme (GENZ) declined below its 20-day EMA and began to find support in the low thirties. The stock began forming a base as early as 17-Apr, but a discernible reversal pattern failed to emerge until the end of May. The bullish abandoned baby formed with a long black candlestick, doji, and long white candlestick. The gaps on either side of the doji reinforced the bullish reversal.
Other Tools To Use With Bullish Reversal Patterns
Candlesticks provide an excellent means to identify short-term reversals, but should not be used alone. Other aspects of technical analysis can and should be incorporated to increase reversal robustness. Below are three ideas on how traditional technical analysis might be combined with candlestick analysis.
Support
Look for bullish reversals at support levels to increase robustness. Support levels can be identified with moving averages, previous reaction lows, trend lines or Fibonacci retracements.
Momentum
Use oscillators to confirm improving momentum with bullish reversals. Positive divergences in MACD, PPO, Stochastics, RSI, StochRSI or Williams %R would indicate improving momentum and increase the robustness behind a bullish reversal pattern.
Money Flow
Volume-based indicators can be helpful in identifying buying and selling pressure. On Balance Volume (OBV), Chaikin Money Flow (CMF) and the Accumulation/Distribution Line can be used in conjunction with candlesticks. Strength in any of these would increase the robustness of a reversal.
For those that want to take it one step further, all three aspects could be combined for the ultimate signal. Look for bullish candlestick reversal in securities trading near support with positive divergences and signs of buying pressure.

A number of signals came together for IBM in early October. After a steep decline since August, the stock formed a bullish engulfing pattern (red oval), which was confirmed three days later with a strong advance. The 10-day Slow Stochastic Oscillator formed a positive divergence and moved above its trigger line just before the stock advanced. Although not in the green yet, CMF showed constant improvement and moved into positive territory a week later.
The Bottom Line
We’ve outlined some of the most common bullish reversal candlestick patterns, their structures, and the market conditions needed for them to form and be considered valid. While these patterns are vital tools in predicting market turnarounds, it is essential to combine them with other technical analysis methods such as support and resistance levels, momentum oscillators, and volume-based indicators for more robust and reliable trading signals. When interpreted correctly, these patterns can provide excellent opportunities for you to enter the market at the initial stages of a new uptrend. However, as with any form of technical analysis, use these patterns cautiously and in conjunction with other tools and risk management strategies.
Bullish Reversal Candlestick Pattern FAQs
What are bullish reversal candlestick patterns?
Bullish reversal candlestick patterns are graphic representations of price movements in trading that suggest a potential reversal of a downward trend, indicating that the price of a security may begin to rise.
What is bullish confirmation, and why is it important?
Bullish confirmation refers to further evidence that supports the prediction of a bullish reversal. It could be a gap up, a long white candlestick, or a high-volume advance. This is important because, without confirmation, the patterns would only indicate a potential support level at best and not a likely reversal.
How can other aspects of technical analysis complement candlestick patterns?
Other aspects of technical analysis, like support levels, momentum oscillators, and volume-based indicators, can increase the robustness of reversal signals. They help validate the predictions made by candlestick patterns and provide a more comprehensive view of the market.
What does a Hammer pattern signify?
The Hammer pattern consists of one candlestick with a small body, a long lower shadow, and a small or nonexistent upper shadow. The long lower shadow is a strong indication that buying pressure has significantly rejected and countered selling pressure, suggesting the strong likelihood of a bullish reversal.
What is the difference between a Morning Star and a Bullish Abandoned Baby?
Both patterns consist of three candlesticks and indicate bullish reversals. The difference lies in the gaps on either side of the doji. A Bullish Abandoned Baby has gaps on both sides of the doji, whereas the Morning Star doesn't necessarily have these gaps.
Charts with Current CandleStick Patterns
StockCharts.com maintains a list of all stocks that currently have common candlestick patterns on their charts in the Predefined Scan Results area. To see these results, click here and then scroll down until you see the “Candlestick Patterns” section. The results are updated throughout each trading day.
—-
Additional Reading
- Have you read our previous article on Candlesticks and Resistance?
- You may also be interested in our next article on Candlestick Bearish Reversal Patterns.
- Reference Tool: Candlestick Pattern Dictionary

