|
|
Table of Contents
P&F Bearish Breakdowns
Introduction
There are five bearish breakdown P&F patterns. In fact, these five are the exact opposite of the five bullish breakdown patterns. The most basic P&F sell signal is a Double Bottom Breakdown, which occurs when an O-Column breaks below the low of the prior O-Column. From this basic pattern, the bearish breakdown patterns become wider and more complex. The wider the pattern, the better established the support level and the more important the subsequent breakdown. This article will look at the five key breakdown patterns in detail and then show measuring techniques for price objectives.
Double Bottom Breakdown
In the P&F world, Double Bottom Breakdowns are bearish patterns that are confirmed with a support break. With bar charts, on the other hand, Double Bottoms are bullish patterns that are confirmed with a resistance break. These patterns are not contradictory. They are simply different patterns with similar names.
As noted above, the most fundamental P&F sell signal is when an O-Column breaks below the low of the prior O-Column. These two columns are separated by an X-Column. O-Columns denote falling prices, while X-Columns signify rising prices. The first falling O-Column establishes direction. The middle X-Column represents a bounce that establishes resistance. The third O-Column triggers the lower low. The inability to hold the prior low shows weakness associated with a downtrend.
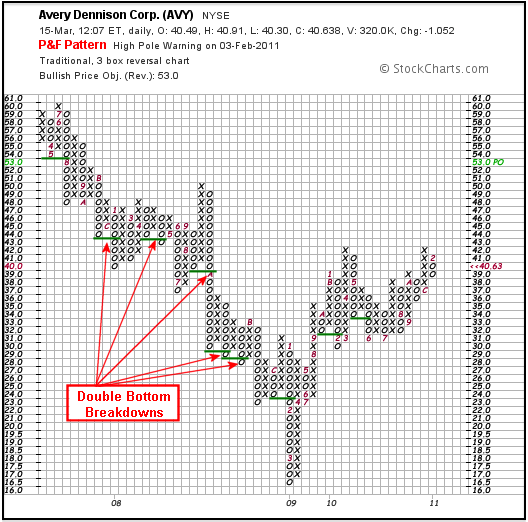
As the most common signal in the P&F universe, Double Bottom Breakdowns are also the most prone to whipsaw and failure. Double Bottom Breakdown signals should be viewed in the context of the bigger picture. It is important to employ other aspects of technical analysis when using signals as common as Double Bottom Breakdowns. The chart below shows Avery Dennison (AVY) with several Double Bottom Breakdowns over the last few years.
Triple Bottom Breakdown
The Triple Bottom Breakdown takes the Double Bottom Breakdown one step further by adding another support column. Two consecutive O-Columns define support with two equal lows. The third O-Column breaks below the lows of the prior two O-Columns to forge the Triple Bottom Breakdown. Classic Triple Bottom Breakdowns are five columns wide: three O-Columns and two X-Columns.
These patterns can mark reversal breakdowns or continuation breakdowns. Distinguishing between reversal and continuation depends on the prior move. A Triple Bottom Breakdown that forms as a top after an advance would be deemed a reversal pattern. A Triple Bottom Breakdown that forms as a consolidation after a decline would be viewed as a continuation pattern.
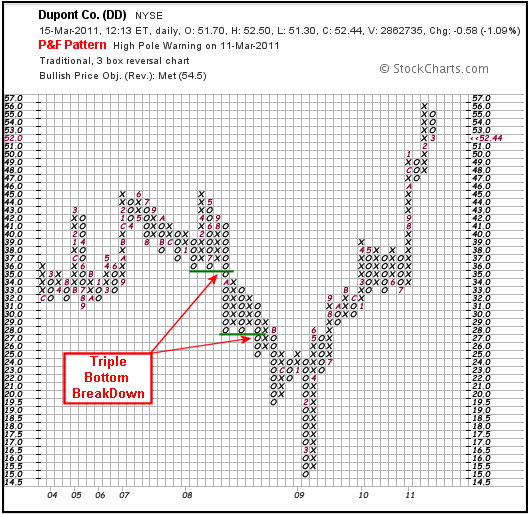
The chart above shows Dupont (DD) with a reversal Triple Bottom Breakdown in the first half of 2008 and then a continuation Triple Bottom Breakdown in the second half. While it is sometimes difficult to distinguish between reversal patterns and continuation patterns, the Triple Bottom Breakdown itself is easy to identify with a clear support break.
Spread Triple Bottom Breakdown
As its name implies, the Spread Triple Bottom Breakdown is an expanded version of the Triple Bottom Breakdown. A Spread Triple Bottom Breakdown contains at least two extra columns, which means it is at least seven columns wide. An extra X-Column and an extra O-Column form lows above the actual support level or breakdown point. These columns in effect add space or width to the Triple Bottom Breakdown. As with a normal Triple Bottom Breakdown, a Spread Triple Bottom Breakdown is confirmed with a break below the lows of the two O-columns. Ideally, a Spread Triple Bottom Breakdown forms as a Triple Bottom Breakdown with only two extra columns. In reality, this pattern can form with more than two extra columns.
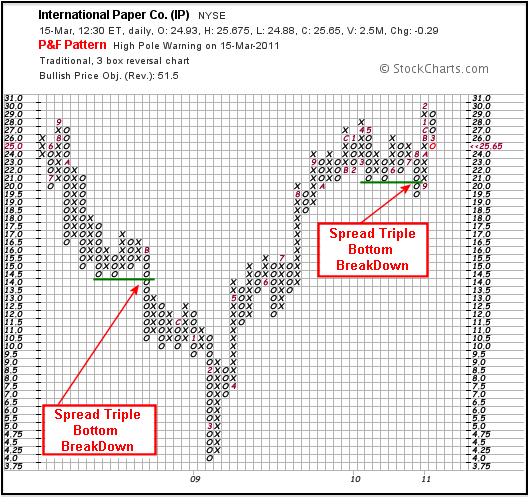
The chart above shows International Paper with two Spread Triple Bottom Breakdowns. The first one in 2008 marked a continuation of the downtrend. The second Spread Triple Bottom Breakdown triggered in August 2010, but resulted in a whipsaw (bad signal). First, the breakdown did not hold long. Second, the X-Column broke above the high of the breakdown column (O-Column).
Descending Triple Bottom Breakdown
A Descending Triple Bottom Breakdown is basically back-to-back Double Bottom Breakdowns. These breakdowns form three O-Columns that move lower and lower with each breakdown. Because there are three O-Columns and two X-Columns, the pattern is just as wide as a classic Triple Bottom Breakdown. The ability to forge back-to-back lower lows shows underlying weakness that is indicative of a downtrend. As with the other patterns, this Descending Triple Bottom Breakdown can form as a continuation or reversal pattern.
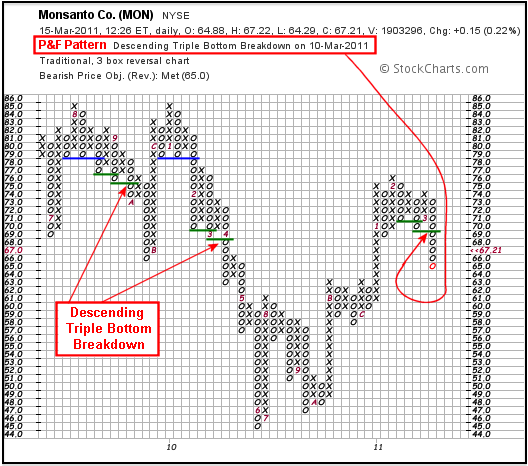
The above chart for Monsanto (MON) shows three Descending Triple Bottom Breakdowns. The first two occurred after Triple Bottom Breakdowns (blue lines), which makes then continuation patterns. The third breakdown formed after an advance that peaked in early 2011. This is a reversal pattern.
Quadruple Bottom Breakdown
The Quadruple Bottom Breakdown is just like the Triple Bottom Breakdown, only with an extra O-Column to mark support and an extra X-Column to widen the pattern. Three consecutive O-Columns define support with three equal lows. The fourth O-Column breaks below the lows of the prior three O-Columns to forge the Quadruple Bottom Breakdown. All told, Quadruple Bottom Breakdowns are seven columns wide with four O-Columns and three X-Columns. These patterns can mark reversal breakdowns or continuation breakdowns.
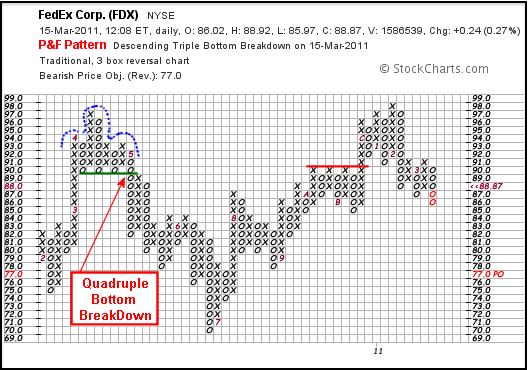
The chart above shows FedEx (FDX) with a reversal Quadruple Bottom Breakdown in May 2010. This reversal pattern also resembles a head-and-shoulders. Notice the relatively equal highs for the shoulders and the spike high for the head. Confirmation is clear with the Quadruple Bottom Breakdown.
Measuring Techniques
First and foremost, be careful with price objectives. They are really just rough guidelines. Chartists should use other aspects of technical analysis to confirm objectives and continuously monitor the state of the trend/breakdown.
The horizontal count method can be applied to Triple Bottom Breakdowns, Descending Triple Bottom Breakdowns, Spread Triple Bottom Breakdowns, and Quadruple Bottom Breakdowns. Simply measure the width of the pattern, multiply by the box size and then by 2/3 the reversal amount. Tom Dorsey and A.W. Cohen advocated 2/3, but some P&F chartists simply use the full reversal amount. Subtract this total from the pattern high for a price objective. The wider the pattern, the bigger the expected move. Triple Bottom Breakdowns are five columns wide (3 O-Columns and 2 X-Columns), Quadruple Bottom Breakdowns are seven columns wide and Spread Triple Bottom Breakdowns are seven columns minimum.
The vertical count method can be applied to Double Bottom Breakdown Breakdowns. After the breakdown, chartists must wait for a 3-box reversal to FIX the height of the breakdown column. The breakdown column is subject to change until there is a reversal. This reversal is considered a mere bounce as long as it does not extend too far. Count the number of filled boxes in the breakdown column, multiply by the box size and then by 2/3 the reversal amount. Subtract this product from the pattern high for a downside price objective.
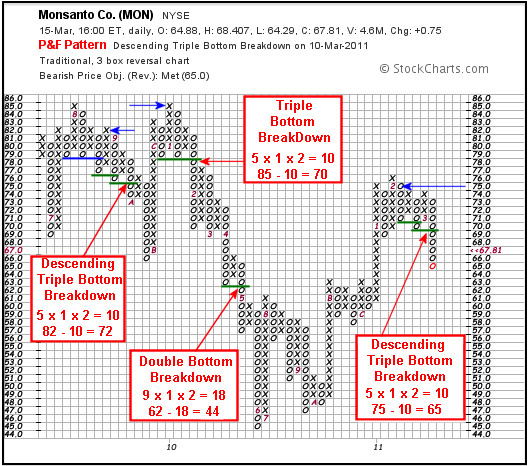
The chart above shows Monsanto (MON) with four bearish breakdown patterns and four downside price objectives. The blue arrows mark the pattern high, from which the extension estimate is subtracted. The first, a Descending Triple Bottom Breakdown, came just after a Triple Bottom Breakdown. Even though the pattern is near the top, it is considered a continuation pattern because it follows the previous breakdown. The second, a Triple Bottom Breakdown, is clearly a reversal pattern because it formed at the prior high. The third, a Double Bottom Breakdown, formed within a downtrend. The vertical count method was used to find a price objective of 44, which missed the bottom by one box. The most recent pattern is a Descending Triple Bottom Breakdown with a downside price objective of 65.
Establishing a price objective only covers the reward part of the risk-reward equation. Chartists should also study the chart to assess risk. A move above resistance or the pattern high would clearly negate a breakdown. The box just above the pattern high often marks the worst-case level for a pattern failure. Similarly, a Double Top Breakout or a contradictory P&F pattern would argue for a reassessment. There are sometimes failure clues before price hits the worst-case level. Chartists should employ other technical analysis techniques to measure risk and monitor the unfolding trend. See our ChartSchool articles for more details on Horizontal Counts, Vertical Counts and Timeframes for P&F charts.
Conclusion
The most basic P&F sell signal comes from a Double Bottom Breakdown. From here, the classic patterns widen to form consolidations with well-defined support levels. Reversal patterns form as a top after an extended advance, while continuation patterns act as a rest after a significant decline. A little congestion, a clear support level, and a definitive breakdown point make these patterns relatively easy to spot.
