|
|
Table of Contents
P&F Catapults
Introduction
P&F Catapults form with two consecutive P&F signals in the same direction. A typical Bullish Catapult forms with a Triple Top Breakout, a pullback and then a Double Top Breakout. The ability to continue higher after the pullback shows underlying strength. A typical Bearish Catapult forms with a Triple Bottom Breakdown, a bounce and then a Double Bottom Breakdown. Selling pressure reasserts itself after a weak bounce to affirm the prior bearish signal.
Bullish Catapult
A Bullish Catapult forms with an initial breakout, a short pullback and a second breakout. While the ideal Bullish Catapult starts with a Triple Top Breakout, Quadruple Top Breakouts or Multiple Top Breakouts are also possible. After the initial Triple Top Breakout, prices reverse and move back into the pattern. The initial breakout or resistance break is usually just 1-3 boxes. Prices move high enough to break resistance and there is not much upside after the initial breakout. A 3-box reversal then forms and a new O-Column declines back into the Triple Top pattern. This is just a pullback because the O-Column does not break below the low of the pattern or forge a Double Bottom Breakdown. Prices then turn back up with a new X-Column that exceeds the prior X-Column to complete the catapult (Double Top Breakout). The pullback into the pattern represents indecision among the bulls. The ability to overcome this indecision with another breakout shows renewed strength.

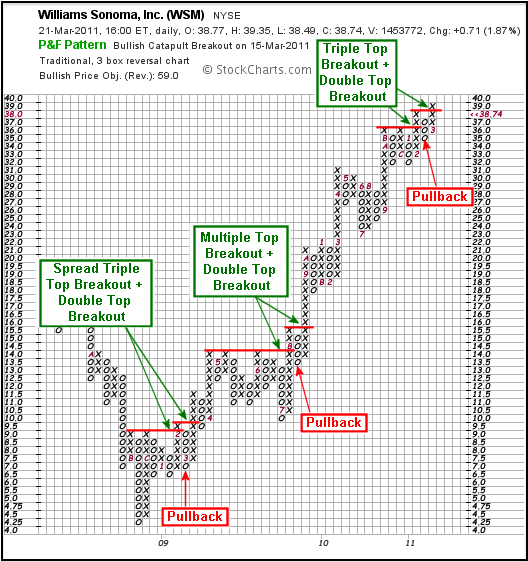
The chart above shows Williams Sonoma (WSM) with three Bullish Catapults. As with most P&F patterns, catapults can form as reversal or continuation patterns, depending on the prior trend. The first Bullish Catapult reversed the downtrend with a Spread Triple Top Breakout in February 2009 and a Double Top Breakout in March. Notice that the breakout was 1-box and the pullback held above the low of the prior O-Column. The second Bullish Catapult occurred with a Multiple Top Breakout, a four-box pullback, and a subsequent Double Top Breakout. The third is a classic Bullish Catapult within an uptrend, which makes it a continuation pattern.
Bearish Catapult
A Bearish Catapult forms with an initial breakdown, a short bounce, and a second breakdown. While the ideal Bearish Catapult starts with a Triple Bottom Breakdown, Quadruple Bottom Breakdowns or Multiple Bottom Breakdowns are also possible. After the initial Triple Bottom Breakdown, prices reverse and move back into the pattern. The initial breakdown or support break is usually just 1-3 boxes. Prices move low enough to break support and there is not much downside after the initial breakdown. A 3-box reversal then forms and a new X-Column advances back into the Triple Bottom pattern. This is a weak bounce because the X-Column does not break below the high of the pattern or forge a Double Bottom Breakout. Prices then turn back down with a new O-Column that exceeds the prior O-Column to complete the catapult (Double Bottom Breakdown). The bounce back into the pattern shows the bulls giving it one more go. However, the bounce is weak and the second breakdown puts the bears in full control.

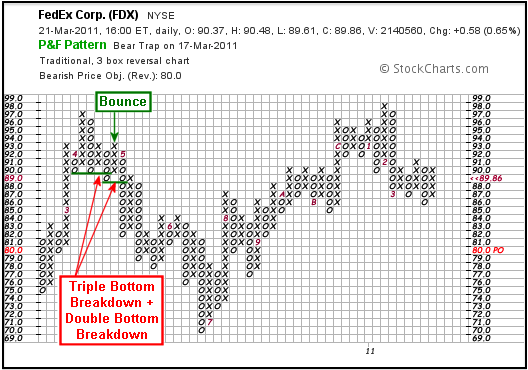
The chart above shows FedEx (FDX) with a Bearish Catapult consisting of a Triple Top Breakdown and a Double Bottom Breakdown. Because the pattern includes the high at 97, it would be considered a reversal pattern. Notice that the bounce carried all the way to the prior high (X-Column), but did not exceed it to negate the pattern.

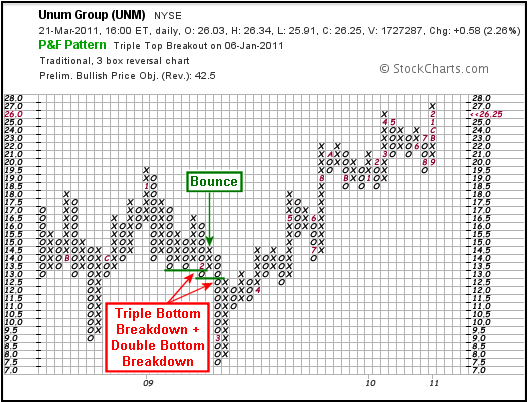
The chart above shows Unum Group (UNM) with a classic Bearish Catapult. This would be considered a bearish continuation pattern because the breakdowns occurred after a couple of Double Bottom Breakdowns and the high formed just before this pattern.
Objectives and Risk
The Horizontal Count Method is the preferred method for these patterns. In short, the width of the pattern is multiplied by the box size and reversal amount to form an estimated extension. This is added to the low of a Bullish Catapult or the subtracted from the high of a Bearish Catapult for a Price Objective. Details and examples can be found the ChartSchool. Price Objectives are not hard targets. Instead, they simply provide a guesstimate for an upside or downside objective.
Chartists should also study the chart to assess risk. For example, a move below support or the pattern low would clearly negate a breakout. The box just below the pattern low often marks the worst-case level for a pattern failure. Similarly, a Double Bottom Breakdown or a contradictory P&F pattern would argue for a reassessment. There are sometimes failure clues before price hits the worst-case level. Chartists should also employ other technical analysis techniques to measure risk and monitor the unfolding trend.
Conclusion
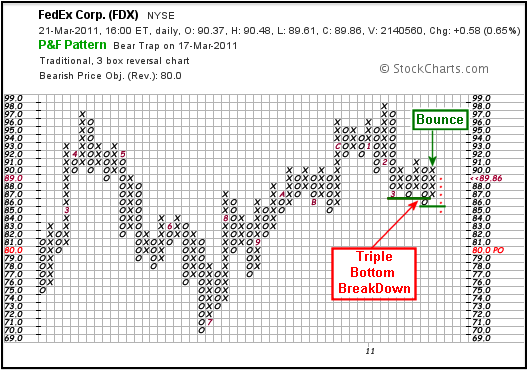
Bullish and Bearish Catapults are at least seven columns wide, which makes them above average in width for P&F patterns. Width is an important aspect of the pattern, as wider patterns indicate a longer congestion phase that makes the subsequent breakout or breakdown all the more important. It is sometimes possible to anticipate a catapult pattern with the 3-box reversal that forms the last column. This would be the seventh column for a classic catapult. The chart below shows FedEx with a possible Bearish Catapult unfolding. After a Triple Top Breakdown, the stock bounced back into the pattern with a 4-box X-Column. The next 3-box reversal down (O-Column) could be used to anticipate further weakness below the prior O-Column. It would take a 5-box O-Column to forge a Double Bottom Breakdown and complete the Bearish Catapult pattern (red dots).

Further Study
Thomas Dorsey's Point & Figure Charting examines the basic ideas and key patterns of P&F charts. Dorsey keeps his analysis simple and straightforward; as a relative strength disciple, he devotes a complete chapter to relative strength concepts using P&F charts. These concepts are tied in with market indicators and sector rotation tools to provide investors with all they need to construct a portfolio. Additionally, Dorsey incorporates lessons on how to use P&F charts with ETFs.
The Definitive Guide to Point and Figure, by Jeremy du Plessis, lives up to its title and is required reading for the Chartered Market Technician exam. Chartists can learn about 1-box P&F patterns/counts, 3-box patterns/counts and various trading strategies. du Plessis also shows how to apply P&F charting techniques to other analysis tools, such as relative strength and Fibonacci retracements, using plenty of real-world examples.


