
|
Table of Contents
Advance-Decline Indicators
Overview
Advance-Decline indicators can be divided into two groups: issue-based indicators, which count the number of advancing issues, declining issues and unchanged issues on a given exchange, and volume-based indicators, which total the volume of advancing issues, the volume of declining issues and the volume of unchanged issues. Issues are mostly common stocks, but can also include closed-end funds, ADRs and preferred stocks.
Net Advances and Net Advancing Volume are also featured in this indicator group, such as AMEX Advance-Decline Issues ($AMAD) and NYSE Advance-Decline Volume ($NYUD). Net Advances equals advances less declines. Net Advancing Volume equals the volume of advancing issues less the volume of declining issues. These “net” versions can be used to create other indicators, such as the AD Line and AD Volume Line.
Details
Symbol Group: Advances, Declines and Unchanged Issues.
Advancing Volume, Declining Volume and Unchanged Volume.

Publisher: Interactive Data Corp (IDC)

Update Frequency: Intraday or End-of-day (EOD)

Links to Current Symbols: Advances, Declines and Unchanged Issues
and Advances, Declines and Unchanged Volume
Exchanges
This group of advance-decline indicators covers five major exchanges. The AMEX, Nasdaq and NYSE are covered on the US side. The Canadian Venture Exchange (CDNX) and Toronto Stock Exchange (TSE) are covered on the Canadian side. The Canadian indicators are updated after the market close (end-of-day EOD).
Sources
The advance-decline data for the five exchanges is sourced from Interactive Data Corp (IDC), StockCharts's primary data feed provider. This data is received in tick form, which StockCharts then converts into intraday and daily data for use in charts.
Note that StockCharts also calculates and publishes a series of breadth indicators specific to the major index ETFs and sector SPDRs. These include Advance-Decline Percent, Advance-Decline Volume Percent and High-Low Percent. These “in-house” breadth indicators are updated after the market close (end-of-day EOD).
Chart Example
The first chart shows the Nasdaq AD Line ($NAAD) using intraday data (30-minute). Chartists can create the AD Line by selecting “cumulative” as “Type” under “Chart Attributes”. This short-term picture can be used by day and swing traders. Click here for a live version of this chart.

The second chart shows the NYSE AD Line ($NYAD) using daily data, while the indicator panels show NY Advances ($NYADV) and NY Declines ($NYDEC) for reference.Click here for a live version of this chart.

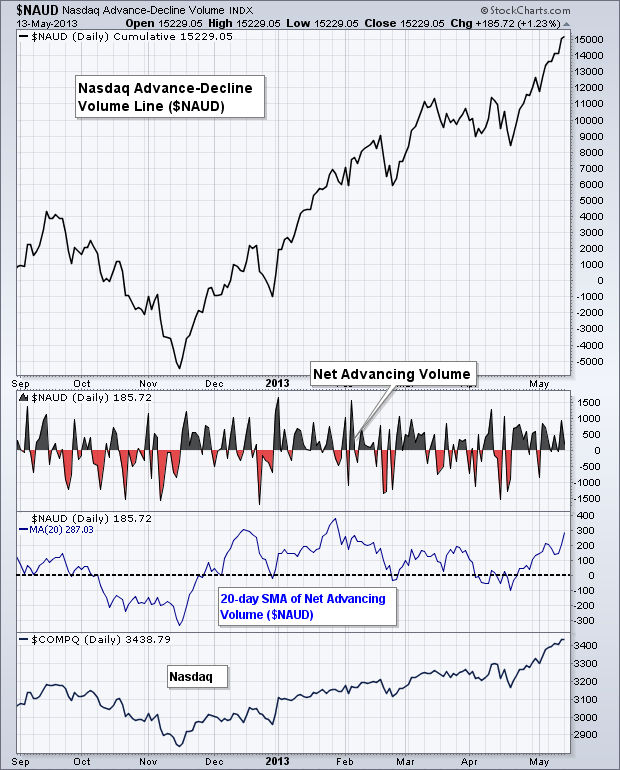
The third chart shows the Nasdaq AD Volume Line ($NAUD) in the main price plot and the raw data in the indicator panels. The first indicator panel shows the daily changes in net advances ($NAUD). Notice how it moves above/below the zero line as net advances shift from positive to negative. The second indicator panel shows the 20-day SMA of Nasdaq Net Advancing Volume ($NAUD), which acts as an oscillator.
Symbol List
StockCharts.com users can access up-to-date lists of symbols for our Advance-Decline Issues Indicators and Advance-Decline Volume Indicators. From these lists, click the “Mentions” icon to the right of a specific symbol for more details about the symbol, as well as recent mentions in Public ChartLists, blog articles, and more.