
|
Table of Contents
DecisionPoint Rydex Asset Analysis
Traditional Sentiment Analysis
Sentiment has traditionally been measured by taking polls of selected groups of investors, advisors, investing professionals, etc. There have been and still are problems associated with this methodology. Firstly, the polls are normally taken over a period of several days, during which time market movement and investor outlook can change radically. In addition, the responses are strictly subjective, reflecting the emotional status of the person being polled, not necessarily said person's investment position.
The idea behind using sentiment indicators is that we are trying to determine when investors have reached a saturation point of bullishness or bearishness. For example, tops are formed when everybody who is going to buy has bought, while bottoms occur after there is no one left to sell. Using subjective measures like sentiment polls makes it difficult to determine exactly when these extremes have been reached; polls have never been particularly good for bottom or top picking. It is important to maintain an awareness of sentiment, but be reluctant to make it one of your primary decision-making tools.
The Rydex Asset Ratio
The Rydex Asset Ratio makes it possible for us to analyze sentiment based upon what investors are actually doing with real money. We do this by calculating a daily bear/bull asset ratio and monitoring the relationship between assets in the two types of funds. When the Rydex Asset Ratio was invented by Steve Todd (Todd Market Forecast) many years ago, it was based on two very small mutual funds – URSA (bear) and NOVA (bull). Because of the small amount of cash involved (and, presumably, the small number of people using the funds), it was subject to extreme movement in either direction, but over the years Rydex added dozens of new funds. Where initially total assets in the two Rydex funds might have been a few hundred million dollars, today Rydex has over 40 funds with billions of dollars in assets. This is a more stable platform from which to derive indicators.
NOTE: All Rydex mutual funds were renamed after the Rydex company was purchased by Guggenheim Investments, but we continue to use the legacy “Rydex” name for the ratios.
Rydex Asset Ratio Calculations
Now let's discuss specific components of the ratio calculations.
Bull Funds: All index funds that are long the stock market.
Sector Funds: All sector funds that are long the stock market. Precious Metals, Government Bond, Bond, Commodities, Strong Dollar and Weak Dollar mutual funds are not included.
Bear Funds: All index funds that are short the stock market.
Money Market: Since money market funds are not invested in bull funds, we consider them to be a mildly bearish vote.
Rydex Asset Ratio Formula:
(Bear Fund Assets + Money Market) / (Bull Fund + Sector Fund Assets)
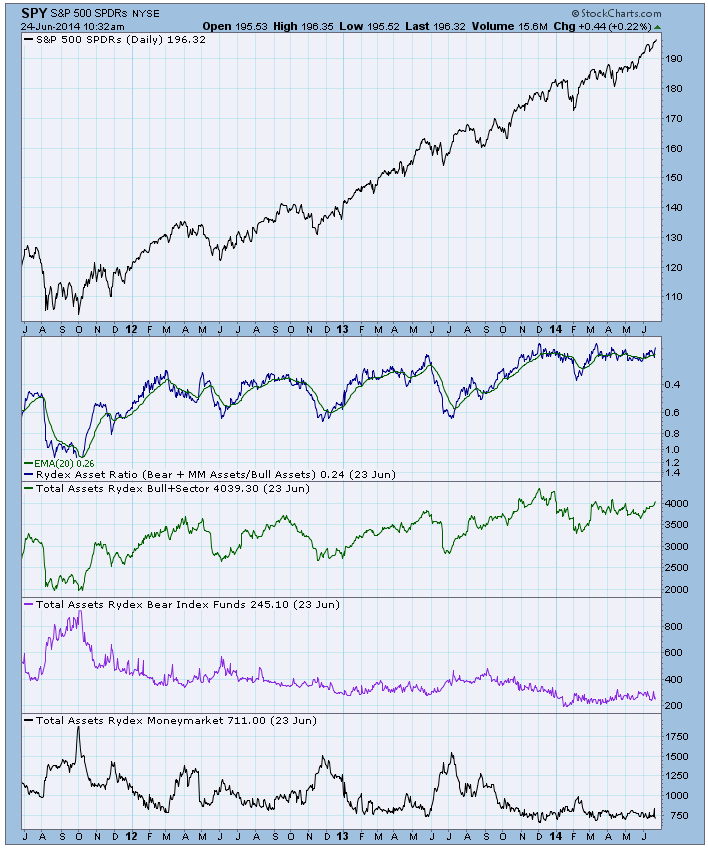
Below is a chart of the asset ratio with its components. Sometimes a careful look at the component charts can clarify movements of the asset ratio.
Using the Rydex Asset Ratio
The Rydex Asset Ratio can be used to gauge sentiment in shorter-term and longer-term timeframes. In our discussions, please note that the ratio charts have an inverted display to make interpretation of the charts more intuitive. By default, higher values indicate bearish sentiment and lower values indicate bullish sentiment. By inverting the chart, we give overbought and oversold readings the same orientation as on the price chart.
Shorter-Term Analysis
For shorter-term timeframes, it is best to view the Rydex Asset Ratio within the context of some kind of overlay. We use a 20-EMA with Bollinger Bands. On the chart below, note that short-term excesses of bullishness or bearishness are identified when the ratio tops or bottoms near the limits of the Bollinger Bands.
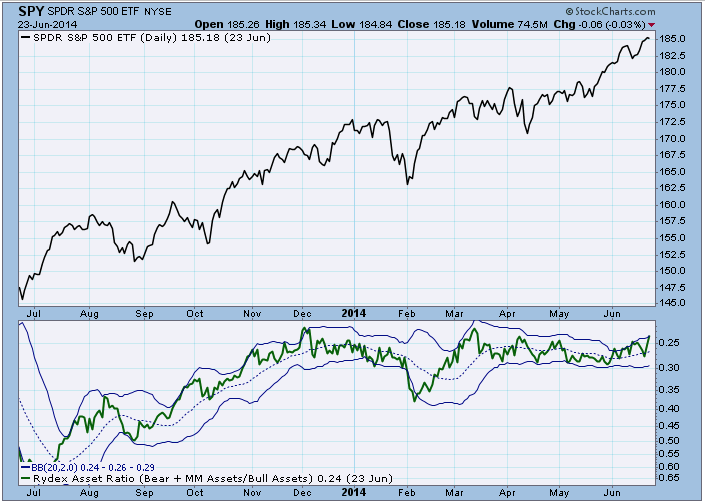
You will also notice that, when the market is trending, the ratio tends to stay on one side or the other of the 20-EMA. During these periods, the 20-EMA becomes support or resistance, enforcing more narrow limits of what is considered overbought or oversold.
Contact with the bands is not always a sign that the move has reached a short-term limit. When the ratio makes a sharp 20-EMA crossover, it signals a possible shift in short-term sentiment. If it subsequently begins “pushing” the bands in the direction of the crossover, it confirms the sentiment shift. We will need to wait for ratio topping or bottoming action before speculating that sentiment has reached a short-term saturation point.
Longer-Term Analysis
While Bollinger Bands help define short-term excesses, longer-term excesses are gauged by looking at the trading range of the ratio over a period of several months or years.

Instead of looking at the ratio levels relative to Bollinger Bands, we compare them to ratio levels during past market tops and bottoms. In this way, ratio levels during past market extremes serve as benchmarks for future market tops and bottoms.
Note that absolute ratio levels can be informative if there are historical references for those same levels, but market direction and context also need to be considered in your analysis.
Conclusion
The Rydex Asset Ratio is a useful tool in evaluating market sentiment, as it is based on where people are putting their money, not just opinions. However, while we use the ratio to infer broad market sentiment, we must remember that Rydex assets represent only a small fraction of assets in the total stock market.