
|
Table of Contents
Identifying Elliott Wave Patterns
Labeling Wave Degrees
Before one can begin to identify the types of patterns Elliott discovered and the rules that govern them, it is a good idea to first learn about the labeling of wave degrees. Counting waves is a skill that comes with practice and proper application of the rules described below. It is a good idea to start applying a wave-count to a market you are familiar with and update it from time to time as practice.
In an Elliott Wave chart, notice that smaller wave structures are labeled differently than the larger wave structures to help distinguish between the degrees of the waves. There is a formal way to label the degrees of Elliott Wave Theory, the details of which can be found in Elliott Wave Principle by Frost and Prechter. For now, we will give a practical description of the labeling and what StockCharts offers.
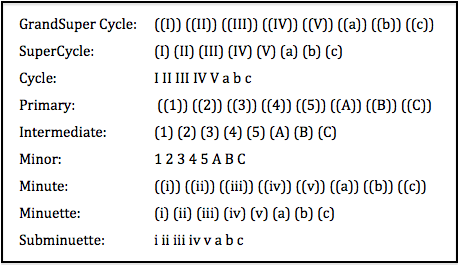
The labeling convention shown above is a hybrid between that shown in the Elliott Wave book and the Elliott tools available in the SharpCharts annotations. In Elliott-speak, this labeling convention is used to identify the degree or level of the wave, which represents the size of the underlying trend. The uppercase Roman numerals represent the large-degree waves, the simple numbers represent the medium-degree waves and the lowercase Roman numerals represent the small-degree waves. The trends start with the largest degree (Grand Supercycle) and work their way down to waves of lesser degree. For example, the Cycle wave is one larger degree than the Primary wave. Conversely, the Primary wave is one lesser degree than the Cycle wave. Wave 1 of (1) would indicate that Wave 1 is part of a larger degree Wave (1). Wave 1 is a lesser degree than Wave (1).
In reality, most chartists will only use 1-3 wave degrees on their charts. It can get quite complicated trying to apply all nine wave degrees on one chart! Chartists using 1 to 3 wave degrees can simply label the highest-degree waves with uppercase Roman numerals (I,II,III,IV,V,a,b,c), the middle-degree waves with numbers (1,2,3,4,5,A,B,C) and the lowest-degree waves with lowercase Roman numerals (i,ii,iii,iv,v,a.b,c). This provides three distinct groups for labeling various waves.
Types of Motive Waves
There are two types of motive waves: the Impulse and the Diagonal. We will now describe both of these types of waves in more detail.
Impulse Waves
The Impulse Wave is the type of wave we have used so far to illustrate how the structure of Elliott Wave is put together. It is the most common motive wave and the easiest to spot in a market. Like all motive waves, five sub-waves: three motive waves and two corrective waves. This is labeled as a 5-3-5-3-5 structure. However, it has three unbreakable rules that define its formation. If one of these rules is violated, then the structure is not an impulse wave and one would need to re-label the suspected impulse wave.
The three rules are:
- Wave 2 cannot retrace more than 100% of Wave 1.
- Wave 3 can never be the shortest of waves 1, 3, and 5.
- Wave 4 can never overlap Wave 1.
The goal of a motive wave is to move the market. Out of all the various types of motive waves, impulse waves are the best at accomplishing this.
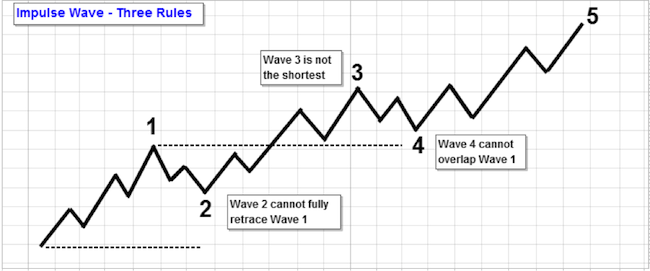
The chart above shows an impulse wave. Notice that Wave 4 does not cross into the price territory of Wave 2, nor does Wave 2 correct below the beginning of Wave 1. Also, see that Wave 3 is not the shortest. Wave 3 can never be the shortest wave; it is usually the longest of the five waves and the most likely to extend (which is covered in the next section).
Sub-wave 3 of an impulse wave will always be another impulse-type motive wave.
Wave 2 cannot move below the beginning of Wave 1. Wave 2 is often known to retrace much of Wave 1, but if it retraces it completely, it is not a Wave 2. A break in price below the low of Wave 1 would invalidate the suspected wave-count and imply that one should look for an alternative way to label the pattern.
Wave Extensions
In the majority of cases, impulse waves will exhibit what is called an “extension” to their normal pattern. This means that one of the impulse wave's three motive sub-waves will be an elongated impulse with exaggerated subdivisions. This can happen in either Wave 1, 3 or 5, typically happening in only one of said waves.
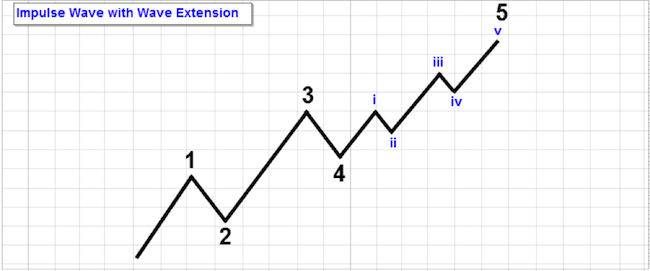
At times, the subdivisions of the extended sub-wave look almost the same in amplitude and time duration as the four other waves in the higher degree impulse wave of which they are a part. Instead of having a wave-count of 5 for the impulse, it is tempting to count 9 waves, as it may not be clear as to which wave is the extended wave. However, it does not really matter in the long run as the technical significance would be the same, even if one had assigned the wrong count.

If you run into difficulty seeing the extended wave, try your best to label the overall impulse and move on. A small guideline may help in this situation: if the potential Wave 1 and Wave 5 of the larger degree impulse look equal in length, then it is most likely Wave 3 which is extended, as it is the wave that most commonly does so.
As an extended wave is also an impulse, extensions can occur within extensions. You may have a few degrees of extensions within one impulse wave.
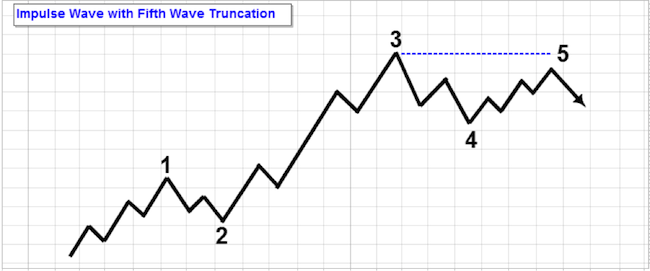
Impulse Wave Truncation (Truncated Fifth)
There are times when the market has become so over-extended in Wave 3 that there is not much force left for the impulse wave to come to a proper completion. When this happens, there is a chance that the last wave of the impulse, Wave 5, will not reach the end of Wave 3 before the market starts correcting in the opposite direction. At this point, the market is just too exhausted. This condition is often called a “failure” or a “Truncation.”
A Truncation, or truncated fifth, consists of 5 sub-waves, like all motive waves. It often occurs after a particularly strong third wave, although there is also a chance that sentiment, for whatever reason, has become so strong in the opposite direction of the trend that a Wave 5 will not terminate beyond the price of Wave 3.
Diagonal Waves
A Diagonal Wave is the second type of motive wave. It is not an impulse wave. However, like all motive waves, it consists of five sub-waves and aims to move the market in the direction of the trend. The difference is that the diagonal looks like a wedge - either expanding or contracting. Also, the sub-waves of the diagonal may not have a count of five, depending on what type of diagonal is being observed. This is explained below.
As with all motive waves, each actionary sub-wave of the diagonal never fully retraces the previous actionary sub-wave; furthermore, sub-wave 3 of the diagonal can never be the shortest wave.
Ending Diagonals
The ending diagonal is a special type of wave that occurs in Wave 5 of an impulse, or the last wave of a correction pattern - Wave C of an A, B, C correction. This wave often occurs when the preceding move of the trend has gone too far, too fast and has run out of steam. In all cases, they are found at the end of the higher degree motive or corrective wave. This wave pattern indicates the termination of the previous trend of one higher degree.
The wave-structure of an ending diagonal is different from the impulse wave. Where the impulse wave had a general structure count of 5-3-5-3-5, the ending diagonal has a structure count of 3-3-3-3-3. All five of the waves of an ending diagonal break down to only three waves each, indicating exhaustion of the larger degree trend. Also, Wave 2 and Wave 4 may overlap each other.
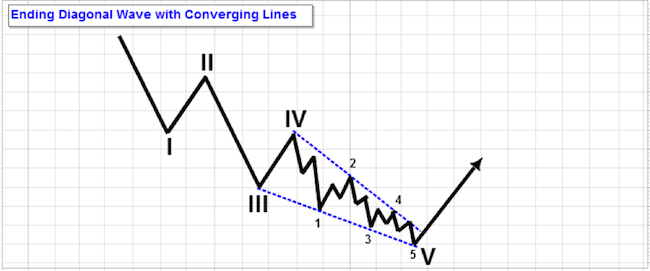
Most ending diagonals have a wedge shape to them where they fit within two converging lines. However, there are cases where the wedge is expanding (though it is rare).
Please keep in mind that the sub-waves of the ending diagonal, consisting of three waves each, are corrective in nature. See the section on corrective waves for more detail on their formation.
Leading Diagonals
Leading diagonals, which are quite rare, are found in either the Wave 1 position of an impulse wave or in the Wave A position of a zigzag correction. They have a 5-3-5-3-5 wave structure like an impulse wave, but, in this case, Wave 2 and Wave 4 overlap and form a wedge pattern with converging boundary lines.
Because of the five-wave subdivisions of Waves 1, 3, and 5, this pattern indicates continuation of the trend, whereas the ending diagonal pattern of 3-3-3-3-3 indicates termination of the trend. After the market corrects - and does not correct beyond the beginning of the leading diagonal - one can expect the trend to continue in the direction of the leading diagonal.
Types of Corrective Waves
When markets move against the trend of one higher degree, they do so with an apparent struggle. This resistance prevents the pattern that forms from developing a motive type of structure; the patterns that do form are more varied than in the motive wave type. An analyst must exercise patience and flexibility when dealing with corrective waves.
There are two styles of corrective waves, the “sharp” correction and the “sideways” correction. The sharp corrections move steeply against the trend of one higher degree, while the sideways correction appears to form a flat type of structure that often goes back to the price of where it began before ending the correction. More details on these are given below, broken down into four main categories.
Please keep in mind that although corrections are often seen as declining in price, the reality is that the market can correct up or down, depending on the trend of higher degree.
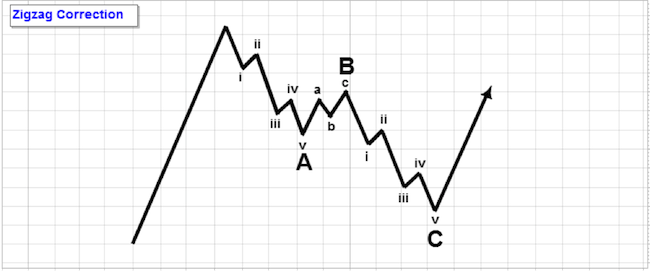
Zigzag Corrections
A single zigzag is a three-wave corrective structure that is labeled as A-B-C. The sub-wave sequence is 5-3-5. We have seen this above in our expanded corrective wave pattern. The A and C waves are motive waves (with 5 sub-waves), while the B wave is corrective (often with 3 sub-waves). The zigzag is known to form a sharp style of correction and, in an impulse wave, usually shows up in the second wave position.
Zigzags may also form in combination and form what is called a double (or triple) zigzag, where two or three zigzags form connected by another corrective wave between them. More detail on the rules for these are given below when we talk about combination corrections.
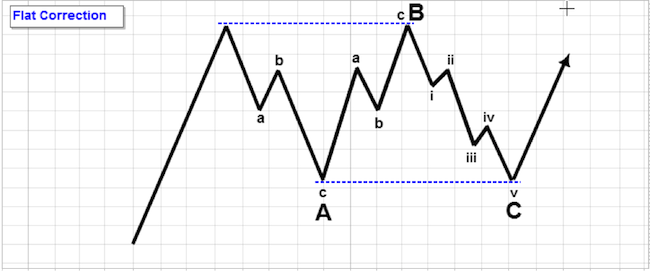
Flat Corrections
The flat correction is another three-wave correction where the sub-waves form a 3-3-5 structure. Like the zigzag, it is also labeled as an A-B-C structure. In this case, both Waves A and B are of the corrective variety and Wave C is motive (with 5 sub-waves). It is called a “flat” because the pattern moves in a sideways direction. Within an impulse wave, the fourth wave often has a flat while the second wave rarely does.
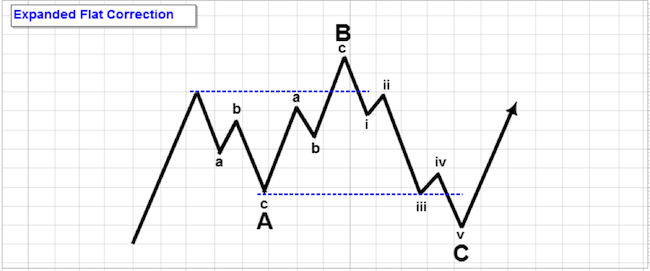
Most flats, however, don't look as neat as this, but are variations on the theme. A flat that has the B wave terminate beyond the start of the A wave and the C wave terminate beyond the start of the B wave is called an expanded flat. This is actually more common in markets than the normal flat shown above.
A running flat, which often occurs in strong trends of one higher degree, will have Wave B terminate beyond the beginning of Wave A, but Wave C will fail to reach the beginning of Wave A. This is a rare case, but it has been known to happen and usually forms in strong trends.
Horizontal Triangles
The horizontal triangle is a pattern that consists of five sub-waves that form a 3-3-3-3-3 structure, labeled as A-B-C-D-E. Unlike the motive wave, which also has five waves, this pattern reflects a balance of forces and travels in a sideways pattern. The sub-waves are corrective and form patterns of threes.
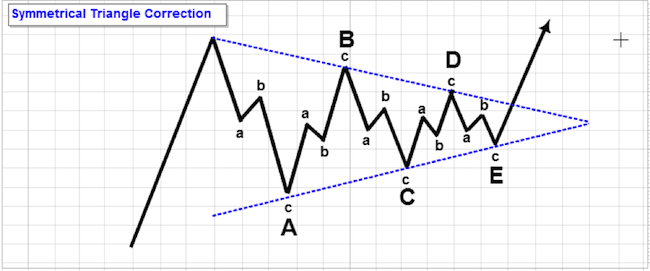
The horizontal triangle can either be expanding, where each following sub-wave gets bigger in amplitude, or contracting, forming a wedge. The triangles may also be categorized as symmetrical, descending or ascending, depending on whether they seem to be pointing sideways (as in the above example), up with a flat top and rising bottoms (ascending) or down with descending tops and a flat bottom.
The sub-waves may be composed of complex combinations, not just of zigzags (shown) or flats. Although it may look easy in theory to spot a triangle, it may take a little practice to become familiar with them in the market.
A triangle may extend by having its fifth wave also be a triangle of lesser degree. Instead of Wave E being a three-wave structure, it will be another horizontal triangle. This just demonstrates the level of complexity that Elliott Wave Theory can reach.
One thing to remember about horizontal triangles is that they always appear in the position prior to the final move of the pattern, or as the final pattern in a combination (described below). This means that they will appear as Wave 4 in an impulse wave or as Wave B in a zigzag. This one fact can help alert an analyst to a change in trend.
Correction Combinations
Markets do not always form the relatively simple patterns seen above. The structure is often complex and confusing. The way Elliott Wave categorizes these structures is what is called a combination.
A combination is composed of the corrective waves seen above and seems to be a corrective wave's way of extending sideways for the most part. Combinations are mostly sideways types of corrections, but can be sharp in the case of the double or triple zigzag. The structure is labeled as W-X-Y, for a double combination, or as W-X-Y-X-Z for a triple combination. The diagram below shows the theoretical breakdown of the wave structure.
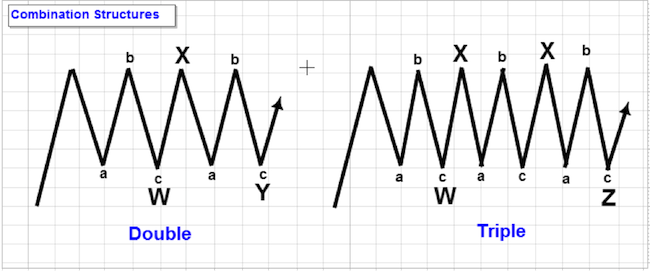
Wave W is any flat or zigzag, Wave X is usually a flat or zigzag (except in the case where a triangle forms, which indicates that the next wave will be the last of the combination) and the rest of the waves may be any corrective type. The only thing to watch out for is the horizontal triangle, which can be either in the last position or the next to the last position - the last Wave X.
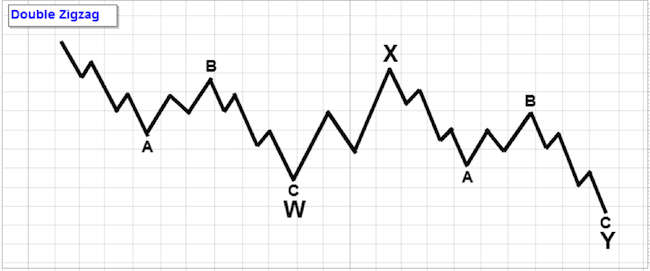
Earlier, we mentioned the double or triple zigzag. Here is what a double zigzag looks like; it also has the W-X-Y labeling. For a triple zigzag, add another Wave X and a final zigzag to form Wave Z.
Next Article in this Series: Guidelines for Applying Elliott Wave Theory