|
This is an old revision of the document!
Table of Contents
Arms Index (TRIN)
Introduction
Also known as the TRIN or Short-Term TRading INdex, the Arms Index is a breadth indicator developed by Richard W. Arms in 1967. The index is calculated by dividing the Advance-Decline Ratio by the Advance-Decline Volume Ratio. Typically, these breadth statistics are derived from NYSE or Nasdaq data, but the Arms Index can be calculated using breadth statistics from other indices such as the S&P 500 or Nasdaq 100. Because it acts as an oscillator, the indicator is often used to identify short-term overbought and oversold situations. A moving average can also be applied to smooth the data series. The terms Arms Index and TRIN are used interchangeably in this article.
Calculation
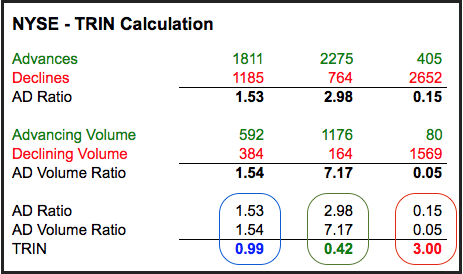
(advances / declines) / (advancing volume / declining volume)
- Advances: number of stocks in the index that closed up on the day
- Declines: number of stocks in the index that closed down on the day
- Advancing Volume: total volume of advancing stocks
- Declining Volume: total volume of declining stocks
Interpretation
As a ratio of two indicators, the Arms Index reflects the relationship between the AD Ratio and the AD Volume Ratio. The TRIN is below 1 when the AD Volume Ratio is greater than the AD Ratio and above 1 when the AD Volume Ratio is less than the AD Ratio. Low readings, below 1, show relative strength in the AD Volume Ratio. High readings, above 1, show relative weakness in the AD Volume Ratio.
In general, strong market advances are accompanied by relatively low TRIN readings because up-volume overwhelms down-volume to produce a relative high AD Volume Ratio. This is why the TRIN appears to move “inverse” to the market. A strong up day in the market usually pushes the Arms Index lower, while a strong down day often pushes the Arms Index higher.
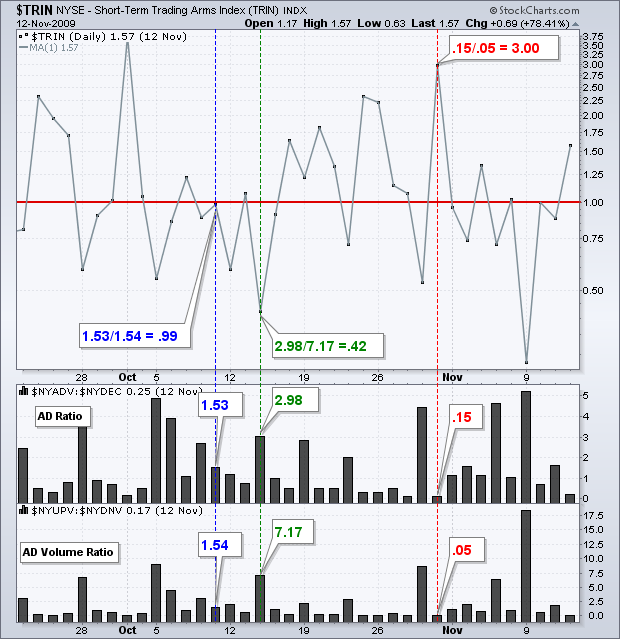
Click here for a live version of the chart.
As you can see in the calculation above and in the corresponding chart below, the AD Volume Ratio surged to 7.17 as up-volume far exceeded down-volume. This produced a TRIN value well below 1 (.42). Similarly, strong declines are usually accompanied by relatively high TRIN readings because down-volume swamps up-volume. In the example above, the AD Volume Ratio plunged to .05 as down-volume crushed up-volume. This produced a TRIN value well above 1 (3.00). Extreme readings in the AD Volume Ratio usually produce extreme TRIN readings.
Chart Scaling
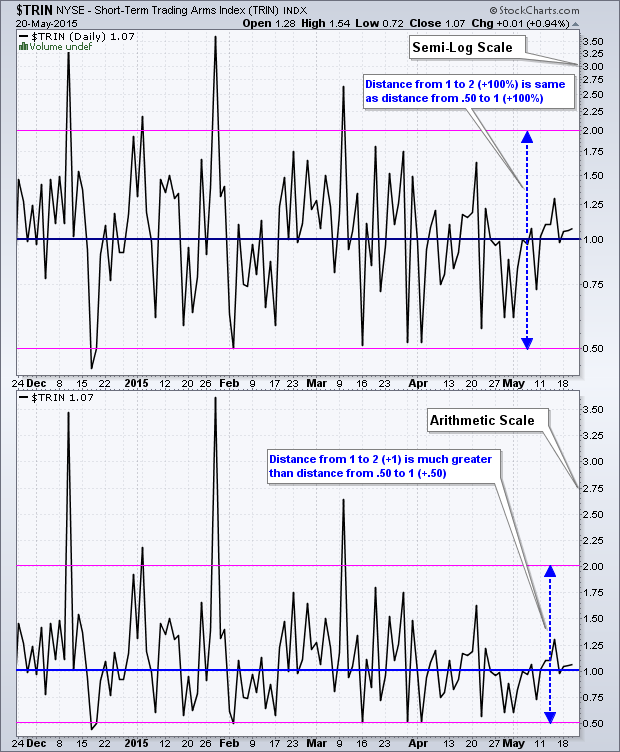
The Arms Index can be displayed with a semi-log scale or an arithmetic scale. Log scaling shows an equal distance for equal percentage movements. Arithmetic scaling shows an equal distance for each unit on the scale. On a log scale, a move from .50 to 1 (+100%) will be the same distance as a move from 1 to 2 (+100%). This is reflected with the dotted blue lines on the chart below. On an arithmetic scale, a move from .50 to 1 (+.50) will be half the size of a move from 1 to 2 (+1).
Click here for a live version of the chart.
The log scale evens out the fluctuations of the Arms Index. Notice how spikes above 2 on the arithmetic scale look out of proportion relative to the overall fluctuations. The data itself is not different, just presented differently. There is no right or wrong answer when it comes to scaling. The choice depends on individual preferences.
Overbought/Oversold
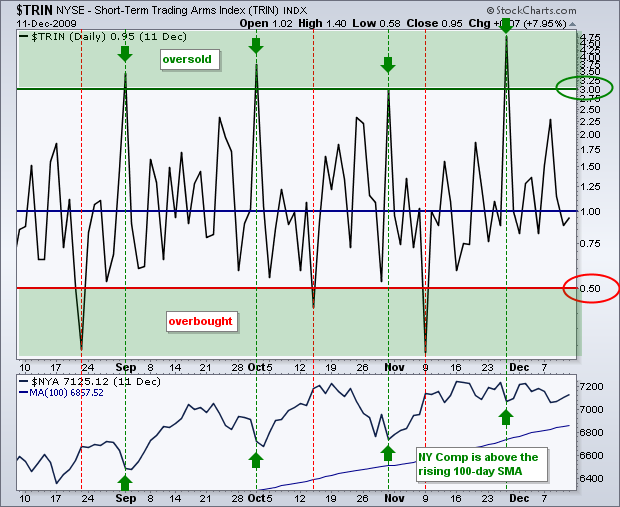
Overbought and oversold levels for the Arms Index depend on the historical range and the smoothing (if any). An unmodified Arms Index will be more volatile and require a larger range to identify overbought/oversold conditions. The chart below shows daily closing values for the NYSE Short-Term Trading Arms Index ($TRIN) with a log scale. Surges above 3 are deemed oversold and dips below .50 are deemed overbought. The NY Composite is in a larger uptrend because it is above its rising 100-day moving average. As such, oversold levels are preferred in order to generate bullish signals in the direction of the bigger uptrend. The green dotted lines show oversold levels in early September, early October, early November and early December, which amount to effectively one per month.
Click here for a live version of the chart.
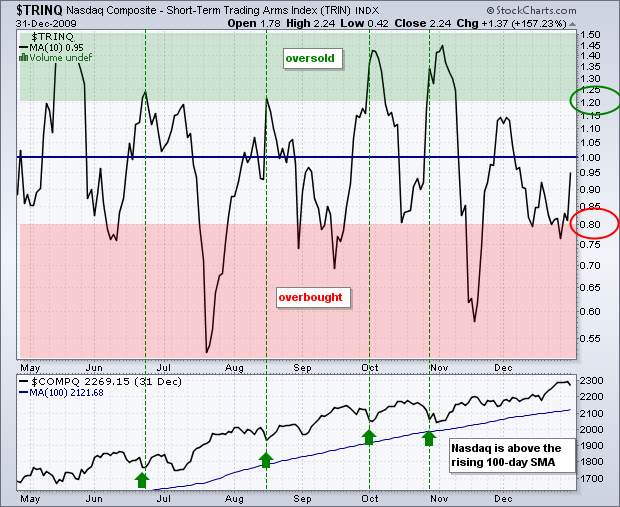
The next chart shows the Nasdaq Short-Term Trading Arms Index ($TRINQ) as a 10-day SMA. This moving average smooths the data series and a smaller range is needed to generate overbought/oversold signals. Notice that the range is narrower, with oversold above 1.20 and overbought below 0.80. With the Nasdaq above its rising 100-day moving average, oversold signals are preferred to trade in line with the bigger trend. There were oversold readings in June, August, September, and October.
Conclusion
The Arms Index is a volatile breadth indicator that can be used to generate overbought and oversold signals. Even though it generates plenty of signals, it is preferable to trade in the direction of the underlying trend. Short-term traders can use the unmodified Arms Index to generate short-term signals or apply a 10-day SMA to generate more medium-term signals. The Arms Index is just one indicator; chartists should employ other aspects of technical analysis to confirm or refute signals generated.
SharpCharts
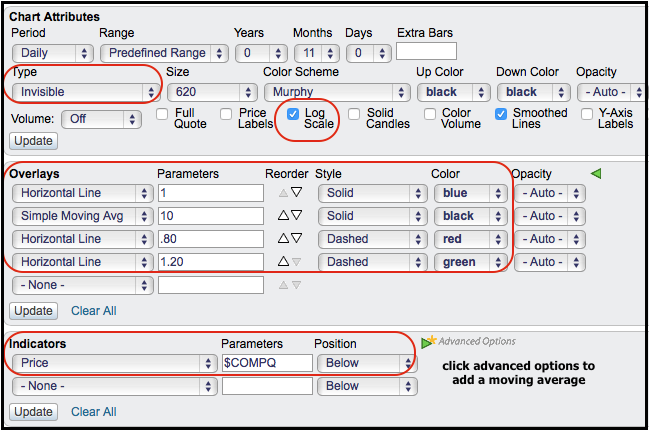
StockCharts.com users can plot the Arms Index for the NYSE ($TRIN) and Nasdaq ($TRINQ). Chartists preferring a log scale, as in the example below, should start with the Arms Index as the main symbol. This places the indicator in the main charting window and users can check the “log scale” option below the chart. To show the indicator as a moving average, select “invisible” as the chart type and then add a moving average as an overlay.
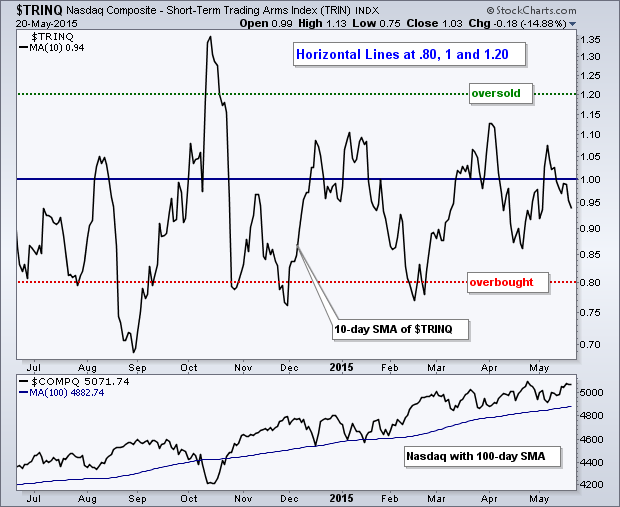
Chartists can also use horizontal lines to define overbought and oversold levels, adding them as individual overlays to differentiate with colors and line styles. Users can also add multiple horizontal lines by entering comma-separated values in the parameters box (.80,1,1.20). The underlying index can be plotted by selecting “price” in the indicator drop down and entering the desired index symbol. Click here for a live chart with the Arms Index.