
|
Table of Contents
Pring's Net New High Indicators
Developed by Martin Pring, these 4 market indicators measure the strength of three different market segments - Commodities, Bonds, and a Global collection of different countries. Each of the indicators is discussed below.
Commodity Net New High Indicators
The Pring Commodity Net New High indicators (!PRNNHCO10 and !PRNNHCO50) are calculated from a basket of commodities and commodity ETFs that register net new highs over a specific span. The two spans calculated by StockCharts are 10 and 50, respectively. If you are plotting a daily chart, the indicator will plot the number of components registering a new high over, say, a 10-day period less those registering new lows over the same period. For a weekly chart, the number of net new highs would be calculated over a 10-week period and so forth. The indicators are not available on an intraday basis.
Chart 1 features the 10-period calculation and Chart 2 the 50-period version. A strong market is signaled when the indicator continues to show a healthy number of components registering new highs. A vulnerable one develops when the number of net new highs shrinks as prices rise. Overbought and oversold readings can be drawn at .4 and -.4 for the 10-period indicator and the action compared to an overall measure of the commodity market. Chart 1 uses the Dow Jones UBS Commodity ETN, the DJP. However, the CRB Composite ($CRB) or PowerShares DB Commodity ETF (DBC) could just as easily be substituted. The indicator itself has been plotted with a 10-period SMA.
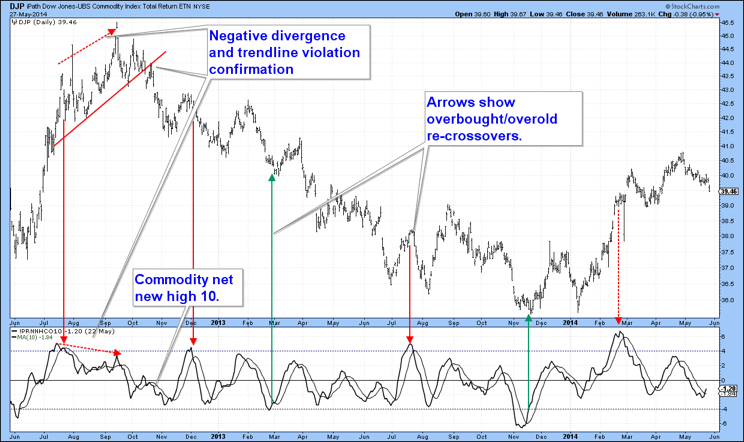
Chart 1
Click here for a live version of the chart.
The arrows show when the indicator crosses through its overbought or oversold reading on its way back to zero. Valid trend reversal signals are usually generated, but the dashed arrow in March 2014 is a reminder that this is not always a successful approach. Positive and negative 10-day MA crossovers can also be used to generate buy and sell alerts. Also apparent is a negative divergence in the left-hand part of the chart, which was subsequently confirmed by the violation of the small red uptrend line.
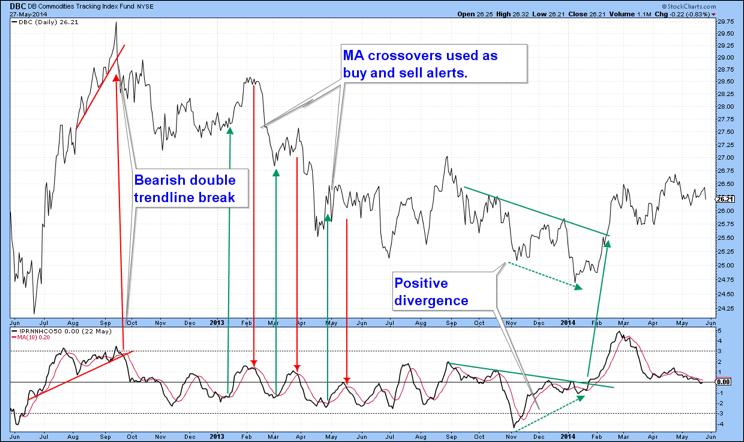
Chart 2
Click here for a live version of the chart.
The other net new high commodity indicator, !PRNNHCO50, makes the same calculation as the !PRNNHCO10, but over a 50-period span. Chart 2, featuring the PowerShares DB Commodity ETF, shows that in addition to overbought/oversold reversals, set at +3 and -3, this series occasionally lends itself to trend line construction and price pattern completion. For instance, a downward-sloping reverse head-and-shoulders pattern was completed in February 2014. Some arrows have been placed in the center of the chart to demonstrate that crossovers of the 10-day (red) SMA often result in timely short-term buy and sell signals. A negative and a positive divergence are also apparent; both were confirmed by trend line violations in the price.
Bond Net New High Indicator
The Pring Bond Net New High Indicator (!PRNNHBND) monitors the number of Net New Highs registered over a 40-period time span. It is derived from a basket of bond ETFs, both US and international. For instance, daily charts would calculate the indicator based on a 40-day time span, hourly by hours, weekly by weeks and so forth. Since the raw series is quite jagged, it has been smoothed with a 40-period moving average.
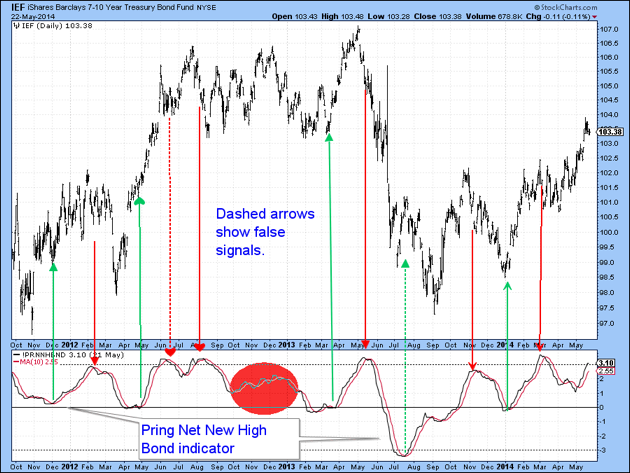
Chart 3
Click here for a live version of the chart.
Chart 3 plots the indicator using daily data. It is principally interpreted by observing moving average crossovers, which alert the trader to the possibility that the direction of the prevailing short-term trend could reverse. The action is usually pretty smooth, but the ellipse highlights that periods of indecision are part of the mix. As with all momentum indicators, one should also make sure there is some confirmation from the price and other indicators, such as the RSI, KST and so forth.
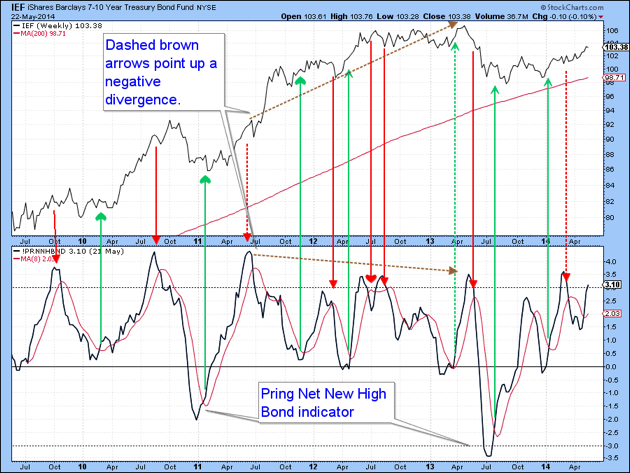
Chart 4
Click here for a live version of the chart.
Chart 4 shows the same indicator plotted on a weekly basis. This series is more suited to intermediate price moves and is otherwise identical in its interpretation with the daily series. The chart demonstrates that overbought/oversold crossovers again come into their own - subject to the occasional false signal, as flagged by the dashed arrows.
Global Net New High Indicator
The Pring Global Net New High Indicator (!PRNNHGL) measures a basket of countries' ETFs that register net new highs over a 40-period time span. The data is then smoothed with a 30-period MA and the (red) signal line is a 12-period moving average of that. The indicator simply measures whether the number of countries registering net new highs is expanding or contracting. Signal line crossovers offer buy and sell signals for the global equity market as reflected by the MSCI World ETF (ACWI).
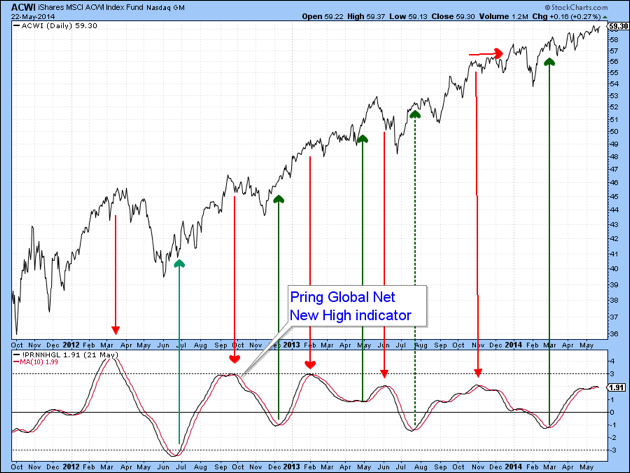
Chart 5
Click here for a live version of the chart.
The dashed arrows flag failed signals. It is worth noting that the indicator merely tells us the number of countries that are reaching new highs or lows, whereas the ACWI is weighted by capitalization. That means it is possible for a few heavily-weighted countries to power the ACWI higher under the cover of fewer stocks registering new highs. Thus, regardless of whether the ACWI moves higher or not, a declining indicator tells us that the environment is becoming progressively more selective.
- Martin Pring