Table of Contents
Arthur Hill on Moving Average Crossovers
Moving Average Crossovers
A popular use for moving averages is to develop simple trading systems based on moving average crossovers. A trading system using two moving averages would give a buy signal when the shorter (faster) moving average advances above the longer (slower) moving average. A sell signal would be given when the shorter moving average crosses below the longer moving average. The speed of the systems and the number of signals generated will depend on the length of the moving averages. Shorter moving average systems will be faster, generate more signals, and be nimble for early entry. However, they will generate more false signals than systems with longer moving averages.
Some Examples
For Inter-Tel (INTL), a 30/100 exponential moving average crossover was used to generate signals (see chart below).
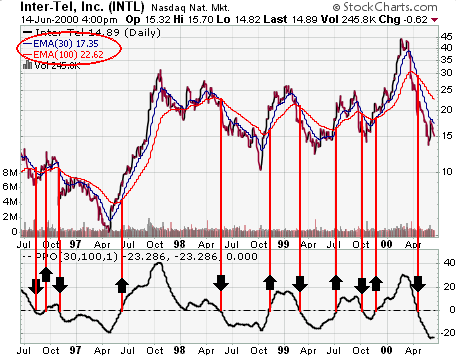
When the 30-day EMA moves above the 100-day EMA, a buy signal is in force. When the 30-day EMA declines below the 100-day EMA, a sell signal is in force. A plot of the 30/100 differential is shown below the price chart by using the Percentage Price Oscillator (PPO) set to (30,100,1). When the differential is positive, the 30-day EMA is greater than the 100-day EMA. When negative, the 30-day EMA is less than the 100-day EMA.
As with all trend-following systems, the signals work well when the stock develops a strong trend but are ineffective when the stock is in a trading range. Some good entry points for long positions were caught in Sept-97, Mar-98, and Jul-99. However, an exit strategy based on the moving average crossover would have given back some profits. Overall, though, the system would have been profitable for the period displayed in the chart.
In the example for 3Com (COMS), a 20/60 EMA crossover system was used to generate buy and sell signals (see chart below).
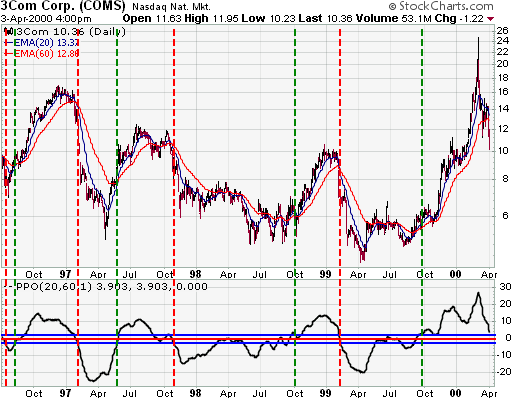
The plot below the price is the 20/60 EMA differential, shown as a percent and displayed using the PPO set at (20,60,1). The thin blue lines above and below zero (the centerline) represent the buy and sell trigger points. Using zero as the crossover point for the buy and sell signals generated too many false signals. Therefore, the buy signal was set just above the zero line (at +2%), and the sell signal was set just below the zero line (at -2%). When the 20-day EMA is more than 2% above the 60-day EMA, a buy signal is in force. When the 20-day EMA is more than 2% below the 60-day EMA, a sell signal is in force.
There were a few good signals, but also a number of whipsaws. Although much would depend on the exact entry and exit points, I believe a profit could have been made using this system, but not a large profit and probably not enough to justify the risk. The stock failed to hold a trend, and tight stop-losses would have been required to lock in profits. A trailing stop or use of the parabolic SAR might have helped lock in profits.
The Bottom Line
Moving average crossover systems can be effective but should be used with other aspects of technical analysis (patterns, candlesticks, momentum, volume, and so on). While it's easy to find a system that worked well in the past, there is no guarantee it will work in the future.
Learn More » Trading With Moving Averages