Table of Contents
TA 101 - Part 5
This is the fifth part of a series of articles about technical analysis from a new course we're developing. If you are new to charting, these articles will give you the “big picture” behind the charts on our site. If you are an “old hand”, these articles will help ensure you haven't “strayed too far” from the basics. Enjoy!
(Click here to see the entire series.)
Candlestick Charts
Compared to traditional OHLC bar charts, many traders consider candlestick charts more visually appealing and easier to interpret. Each candlestick provides an easy-to-decipher picture of price action. An analyst can quickly understand the relationship between the opening and closing price as well as the high and low price.
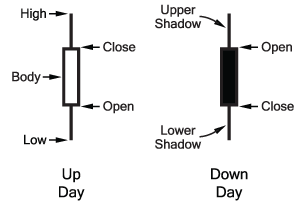
The graphic above shows how candlesticks are constructed.
Candlesticks with hollow bodies indicate buying pressure and filled bodies indicate selling pressure. Long upper or lower shadows form when the market moves significantly in a particular direction during the day and then reverses before the end of the day. As a result, long lower shadows can infer bullishness while long upper shadows can infer a bearish market.
Candlestick Colors
When the 'Color Prices' option is selected on the Chart Attributes workbench, the Candlestick's outline and body will be colored black or red, depending on the candlestick's opening and closing prices and the previous day's closing price.
If the closing price is higher than the opening price, the body will be displayed hollow. If the closing price is lower than the opening price, the body will be filled red with the following exception; if the closing price is higher than the previous day's closing price, the body will then be filled black.
The candlestick's shadows and body outline are colored black or red depending on the closing price compared to the previous day's closing price. If the closing price is higher than the previous day's, the candlestick's shadows and body outline will be colored black. If the closing price is lower than the previous day's, however, the candlestick's shadows and body outline will be red.
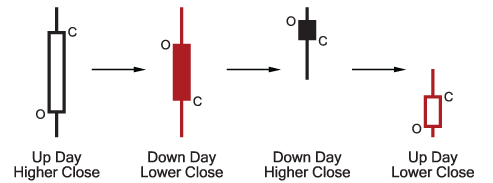
Market psychology is reflected in each of these candlestick formations in the following ways.
Up Day, Higher Close: Typically results from expectations of higher prices (greed) out weighing expectations of lower prices (fear). The length of the candlestick body shown indicates especially strong buying.
Down Day, Lower Close: Expectations of lower prices (fear) are stronger than those of higher prices (greed). As with the first candlestick, a longer candlestick body infers greater urgency of investors to sell their shares.
Down Day, Higher Close: A rare candlestick, this one begins with an opening gap up in price from the previous day's closing price but closes down for the day. A gap is defined as a price range where no trading takes place and is the result of a significant change in demand (gap up) or supply (gap down) before trading begins for the day. In this case, heavy buying at the beginning of the day reversed but still closed higher than the previous day. This is a bearish sign when it occurs well into an upward price move.
Up Day, Lower Close: Another rare candlestick, this one begins with an opening gap down in price from the previous day's closing price but closes up for the day. This price action can be considered bullish during a downward price move since initial strong selling in the day becomes exhausted and buyers push the price higher at close.
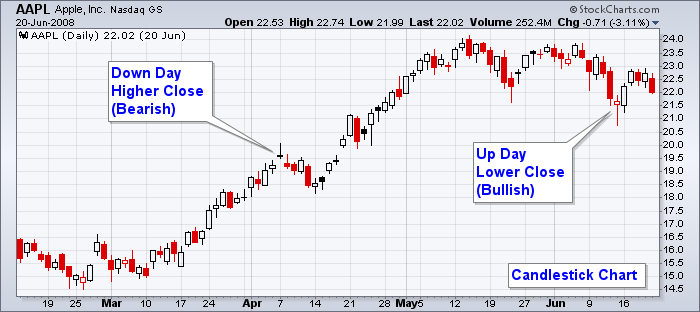
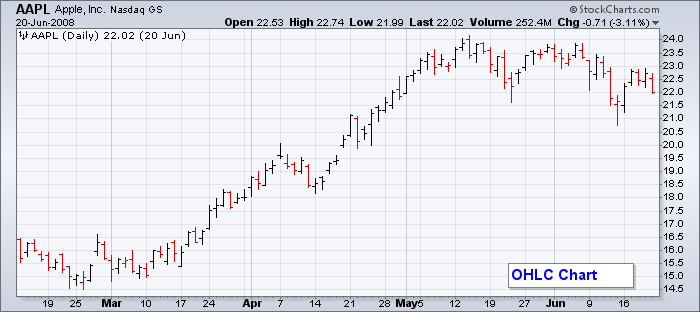
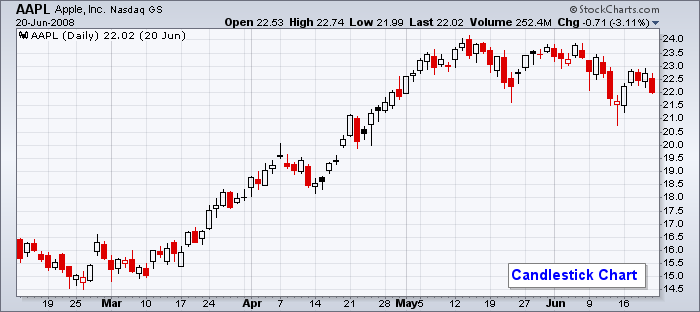
The SharpChart AAPL above illustrates the candlestick format. The up and down days are readily apparent with the use of candlestick charting. When the balance between buyers and sellers change, candlesticks often form recognizable patterns signaling the change. These candlestick patterns will be discussed in a later article.
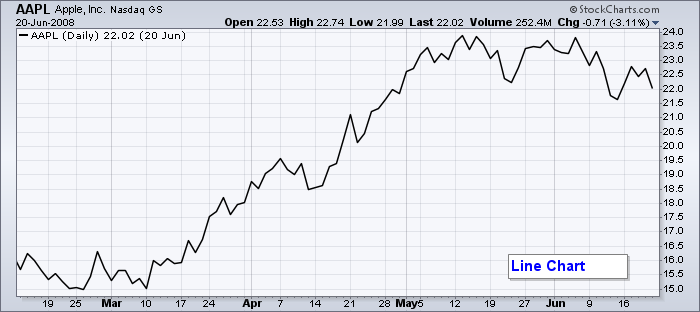
Below, you can see how the three types of charts compare visually:
Next time, we'll get into chart scaling, volume, and CandleVolume charts.