This is an old revision of the document!
Table of Contents
Technical Analysis
What is Technical Analysis?
Technical Analysis is the forecasting of future financial price movements based on an examination of past price movements. Like weather forecasting, technical analysis does not result in absolute predictions about the future. Instead, technical analysis can help investors anticipate what is “likely” to happen to prices over time. Technical analysis uses a wide variety of charts that show price over time.
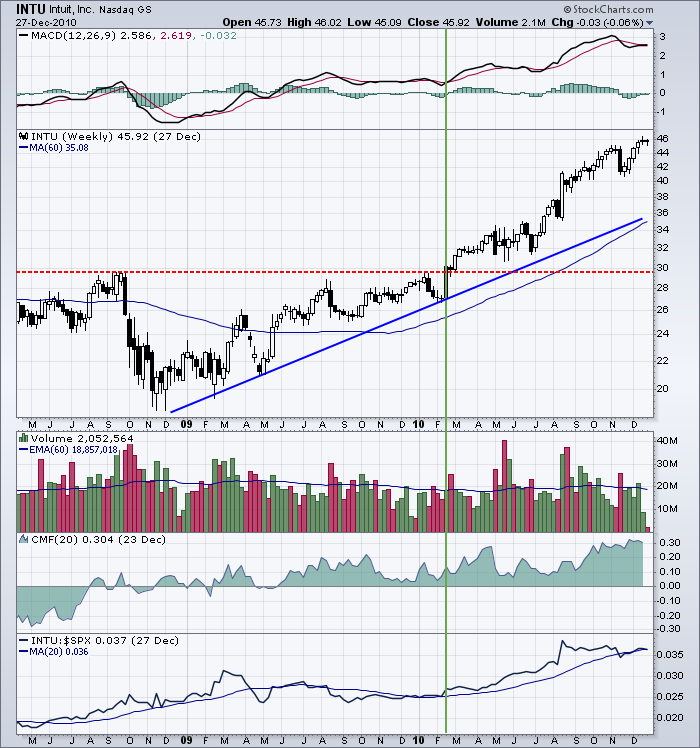
 Technical Analysis example chart from StockCharts.com")
 Technical Analysis example chart from StockCharts.com")
Technical analysis is applicable to stocks, indices, commodities, futures or any tradable instrument where the price is influenced by the forces of supply and demand. Price data (or as John Murphy calls it, “market action”) refers to any combination of the open, high, low, close, volume, or open interest for a given security over a specific timeframe. The timeframe can be based on intraday (1-minute, 5-minutes, 10-minutes, 15-minutes, 30-minutes or hourly), daily, weekly or monthly price data and last a few hours or many years.
Key Assumptions of Technical Analysis
Technical analysis is applicable to securities where the price is only influenced by the forces of supply and demand. Technical analysis does not work well when other forces can influence the price of the security. In order to be successful, technical analysis makes three key assumptions about the securities that are being analyzed:
- High Liquidity - Liquidity is essentially volume. Heavily-traded stocks allow investors to trade quickly and easily, without dramatically changing the price of the stock. Thinly-traded stocks are more difficult to trade, because there aren't many buyers or sellers at any given time, so buyers and sellers may have to change their desired price considerably in order to make a trade. In addition, low liquidity stocks are often very low priced (sometimes less than a penny per share), which means that their prices can be more easily manipulated by individual investors. These outside forces acting on thinly-traded stocks make them unsuitable for technical analysis.
- No Artificial Price Changes - Splits, dividends, and distributions are the most common “culprits” for artificial price changes. Though there is no difference in the value of the investment, artificial price changes can dramatically affect the price chart and make technical analysis difficult to apply. This kind of price influence from outside sources can be easily addressed by adjusting the historical data prior to the price change.
- No Extreme News - Technical analysis cannot predict extreme events, including business events such as a company's CEO dying unexpectedly, and political events such as a terrorist act. When the forces of “extreme news” are influencing the price, technicians have to wait patiently until the chart settles down and starts to reflect the “new normal” that results from such news.
It is important to determine whether or not a security meets these three requirements before applying technical analysis. That's not to say that analysis of any stock whose price is influenced by one of these outside forces is useless, but it will affect the accuracy of that analysis.
The Basis of Technical Analysis
At the turn of the century, the Dow Theory laid the foundations for what was later to become modern technical analysis. Dow Theory was not presented as one complete amalgamation, but rather pieced together from the writings of Charles Dow over several years. Of the many theorems put forth by Dow, three stand out:
- Price discounts everything
- Price movements are not totally random
- “What” is more important than “Why”
Price Discounts Everything
This theorem is similar to the strong and semi-strong forms of market efficiency. Technical analysts believe that the current price fully reflects all information. Because all information is already reflected in the price, it represents the fair value, and should form the basis for analysis. After all, the market price reflects the sum knowledge of all participants, including traders, investors, portfolio managers, buy-side analysts, sell-side analysts, market strategist, technical analysts, fundamental analysts and many others. It would be folly to disagree with the price set by such an impressive array of people with impeccable credentials. Technical analysis utilizes the information captured by the price to interpret what the market is saying with the purpose of forming a view on the future.
Prices Movements are Not Totally Random
Most technicians agree that prices trend. However, most technicians also acknowledge that there are periods when prices do not trend. If prices were always random, it would be extremely difficult to make money using technical analysis. In his book, Schwager on Futures: Technical Analysis, Jack Schwager states:
“One way of viewing the situation is that markets may witness extended periods of random fluctuation, interspersed with shorter periods of nonrandom behavior… The goal of the chart analyst is to identify those periods (i.e. major trends).” (p. 12)
 Technical Analysis example chart from StockCharts.com")
A technician believes that it is possible to identify a trend, invest or trade based on the trend and make money as the trend unfolds. Because technical analysis can be applied to many different timeframes, it is possible to spot both short-term and long-term trends. The IBM chart illustrates Schwager's view on the nature of the trend. The broad trend is up, but it is also interspersed with trading ranges. In between the trading ranges are smaller uptrends within the larger uptrend. The uptrend is renewed when the stock breaks above the trading range. A downtrend begins when the stock breaks below the low of the previous trading range.
"What" is More Important than "Why"
In his book, The Psychology of Technical Analysis, Tony Plummer paraphrases Oscar Wilde by stating, “A technical analyst knows the price of everything, but the value of nothing”. Technicians, as technical analysts are called, are only concerned with two things:
- What is the current price?
- What is the history of the price movement?
The price is the end result of the battle between the forces of supply and demand for the company's stock. The objective of analysis is to forecast the direction of the future price. By focusing on price and only price, technical analysis represents a direct approach. Fundamentalists are concerned with why the price is what it is. For technicians, the why portion of the equation is too broad and many times the fundamental reasons given are highly suspect. Technicians believe it is best to concentrate on what and never mind why. Why did the price go up? There were simply more buyers (demand) than sellers (supply). After all, the value of any asset is only what someone is willing to pay for it. Who needs to know why?
General Steps to Technical Evaluation
Many technicians employ a top-down approach that begins with broad-based macro analysis. The larger parts are then broken down to base the final step on a more focused/micro perspective. Such an analysis might involve three steps:
- Broad market analysis through the major indices such as the S&P 500, Dow Industrials, NASDAQ and NYSE Composite.
- Sector analysis to identify the strongest and weakest groups within the broader market.
- Individual stock analysis to identify the strongest and weakest stocks within select groups.
The beauty of technical analysis lies in its versatility. Because the principles of technical analysis are universally applicable, each of the analysis steps above can be performed using the same theoretical background. You don't need an economics degree to analyze a market index chart. You don't need to be a CPA to analyze a stock chart. Charts are charts. It does not matter if the timeframe is 2 days or 2 years. It does not matter whether you are looking at a stock, market index or commodity. The technical principles of support, resistance, trend, trading range and other aspects can be applied to any chart. As simple as this may sound, technical analysis is far from easy. Success requires serious study, dedication, and an open mind.
Chart Analysis
Technical analysis can be as complex or as simple as you want it. The example below represents a simplified version. Since we are interested in buying stocks, the focus will be on spotting bullish situations.
Overall Trend: The first step is to identify the overall trend. This can be accomplished with trend lines, moving averages or peak/trough analysis. For example, the trend is up as long as price remains above its upward sloping trend line or a certain moving average. Similarly, the trend is up as long as higher troughs form on each pullback and higher highs form on each advance.
Support: Areas of congestion and previous lows below the current price mark the support levels. A break below support would be considered bearish and detrimental to the overall trend.
Resistance: Areas of congestion and previous highs above the current price mark the resistance levels. A break above resistance would be considered bullish and positive for the overall trend.
Momentum: Momentum is usually measured with an oscillator such as MACD. If MACD is above its 9-day EMA (exponential moving average) or positive, then momentum will be considered bullish, or at least improving.
Buying/Selling Pressure: For stocks and indices with volume figures available, an indicator that uses volume is used to measure buying or selling pressure. When Chaikin Money Flow is above zero, buying pressure is dominant. Selling pressure is dominant when it is below zero.
Relative Strength: The price relative is a line formed by dividing the security by a benchmark. For stocks, it is usually the price of the stock divided by the S&P 500. The plot of this line over a period of time will tell us if the stock is outperforming (rising) or underperforming (falling) the major index.
The final step is to synthesize the above analysis to ascertain the following:
- Strength of the current trend.
- Maturity or stage of the current trend.
- Reward-to-risk ratio of a new position.
- Potential entry levels for a new long position.
Top-Down Technical Analysis
For each segment (market, sector, and stock), an investor would analyze long-term and short-term charts to find those that meet specific criteria. Analysis will first consider the market in general, perhaps the S&P 500. If the broader market were considered to be in bullish mode, analysis would proceed to a selection of sector charts. Those sectors that show the most promise would be singled out for individual stock analysis. Once the sector list is narrowed to 3-4 industry groups, individual stock selection can begin. With a selection of 10-20 stock charts from each industry, a selection of 3-4 of the most promising stocks in each group can be made. How many stocks or industry groups make the final cut will depend on the strictness of the criteria set forth. Under this scenario, we would be left with 9-12 stocks from which to choose. These stocks could even be broken down further to find the 3-4 of the strongest of the strong.
Strengths of Technical Analysis
Focus on Price
If the objective is to predict the future price, then it makes sense to focus on price movements. Price movements usually precede fundamental developments. By focusing on price action, technicians are automatically focusing on the future. The market is thought of as a leading indicator and generally leads the economy by 6 to 9 months. To keep pace with the market, it makes sense to look directly at the price movements. More often than not, change is a subtle beast. Even though the market is prone to sudden knee-jerk reactions, hints usually develop before significant moves. A technician will refer to periods of accumulation as evidence of an impending advance and periods of distribution as evidence of an impending decline.
Supply, Demand, and Price Action
Many technicians use the open, high, low and close when analyzing the price action of a security. There is information to be gleaned from each bit of information. Separately, these will not be able to tell much. However, taken together, the open, high, low and close reflect forces of supply and demand.
 Technical Analysis example chart from StockCharts.com")
The annotated example above shows a stock that opened with a gap up. Before the open, the number of buy orders exceeded the number of sell orders and the price was raised to attract more sellers. Demand was brisk from the start. The intraday high reflects the strength of demand (buyers). The intraday low reflects the availability of supply (sellers). The close represents the final price agreed upon by the buyers and the sellers. In this case, the close is well below the high and much closer to the low. This tells us that even though demand (buyers) was strong during the day, supply (sellers) ultimately prevailed and forced the price back down. Even after this selling pressure, the close remained above the open. By looking at price action over an extended period of time, we can see the battle between supply and demand unfold. In its most basic form, higher prices reflect increased demand and lower prices reflect increased supply.
Support/Resistance
Simple chart analysis can help identify support and resistance levels. These are usually marked by periods of congestion (trading range) where the prices move within a confined range for an extended period, telling us that the forces of supply and demand are deadlocked. When prices move out of the trading range, it signals that either supply or demand has started to get the upper hand. If prices move above the upper band of the trading range, then demand is winning. If prices move below the lower band, then supply is winning.
Pictorial Price History
Even if you are a tried and true fundamental analyst, a price chart can offer plenty of valuable information. The price chart is an easy-to-read historical account of a security's price movement over a period of time. Charts are much easier to read than a table of numbers. On most stock charts, volume bars are displayed at the bottom. With this historical picture, it is easy to identify the following:
- Reactions prior to and after important events.
- Past and present volatility.
- Historical volume or trading levels.
- Relative strength of a stock versus the overall market.
Assist with Entry Point
Technical analysis can help with timing a proper entry point. Some analysts use fundamental analysis to decide what to buy and technical analysis to decide when to buy. It is no secret that timing can play an important role in performance. Technical analysis can help spot demand (support) and supply (resistance) levels as well as breakouts. Simply waiting for a breakout above resistance or buying near support levels can improve returns.
It is also important to know a stock's price history. If a stock you thought was great for the last 2 years has traded flat for those two years, it would appear that Wall Street has a different opinion. If a stock has already advanced significantly, it may be prudent to wait for a pullback. Or, if the stock is trending lower, it might pay to wait for buying interest and a trend reversal.
Weaknesses of Technical Analysis
Analyst Bias
Just as with fundamental analysis, technical analysis is subjective and our personal biases can be reflected in the analysis. It is important to be aware of these biases when analyzing a chart. If the analyst is a perpetual bull, then a bullish bias will overshadow the analysis. On the other hand, if the analyst is a disgruntled eternal bear, then the analysis will probably have a bearish tilt.
Open to Interpretation
Furthering the bias argument is the fact that technical analysis is open to interpretation. Even though there are standards, many times two technicians will look at the same chart and paint two different scenarios or see different patterns. Both will be able to come up with logical support and resistance levels as well as key breaks to justify their position. While this can be frustrating, it should be pointed out that technical analysis is more like an art than a science, akin to economics. Is the cup half-empty or half-full? It is all in the eye of the beholder.
Too Late
Technical analysis has been criticized for being too late. By the time the trend is identified, a substantial portion of the move has already taken place. After such a large move, the reward to risk ratio is not great. Lateness is a particular criticism of Dow Theory.
Always Another Level
Even after a new trend has been identified, there is always another “important” level close at hand. Technicians have been accused of sitting on the fence and never taking an unqualified stance. Even if they are bullish, there is always some indicator or some level that will qualify their opinion.
Trader's Remorse
Not all technical signals and patterns work. When you begin to study technical analysis, you will come across an array of patterns and indicators with rules to match. For instance: A sell signal is given when the neckline of a head and shoulders pattern is broken. Even though this is a rule, it is not steadfast and can be subject to other factors such as volume and momentum. In that same vein, what works for one particular stock may not work for another. A 50-day moving average may work great to identify support and resistance for IBM, but a 70-day moving average may work better for Yahoo. Even though many principles of technical analysis are universal, each security will have its own idiosyncrasies.
Conclusion
Technical analysts consider the market to be 80% psychological and 20% logical. Fundamental analysts consider the market to be 20% psychological and 80% logical. Psychological or logical may be open for debate, but there is no questioning the current price of a security. After all, it is available for all to see and nobody doubts its legitimacy. The price set by the market reflects the sum knowledge of all participants, and we are not dealing with lightweights here. These participants have considered (discounted) everything under the sun and settled on a price to buy or sell. These are the forces of supply and demand at work. By examining price action to determine which force is prevailing, technical analysis focuses directly on the bottom line: What is the price? Where has it been? Where is it going?
Even though there are some universal principles and rules that can be applied, it must be remembered that technical analysis is more of an art form than a science. As an art form, it is subject to interpretation. However, it is also flexible in its approach and each investor should use only that which suits his or her style. Developing a style takes time, effort and dedication, but the rewards can be significant.