
|
Table of Contents
Anchored VWAP
What Is the Anchored VWAP?
The Anchored Volume Weighted Average Price (Anchored VWAP) is a trading indicator that provides the average price of a security from a specific starting point (the “anchor”), factoring in price and volume. It's used to confirm trends and identify areas of support and resistance on the chart
Unlike the traditional Volume Weighted Average Price (VWAP), which resets daily and provides the average price of a security within a single trading day, the Anchored VWAP provides a more flexible view by allowing traders to set an anchor point from which the calculation begins. This can be a significant high or low, an earnings announcement, a gap, or any point of interest.
The Anchored VWAP indicator ties VWAP calculations to a specific price bar the trader chooses. Like the traditional VWAP, it incorporates price and volume in a weighted average and can be used to identify areas of support and resistance on the chart.
However, traditional VWAP calculations always start with the first bar of the day and end with the final bar of the day. In some situations, a chartist would prefer to analyze the VWAP line based on a less arbitrary starting point and be able to extend that VWAP line beyond the end of the trading day.
Anchored VWAP allows you to specify the price bar where calculations begin, making it easy to see whether the bulls or bears have been in charge since a very specific point in time. The starting price bar that is chosen generally marks a shift in market psychology, such as a significant high or low, earnings, news, or other announcements. The Anchored VWAP line is charted using price and volume data from that significant event onward.
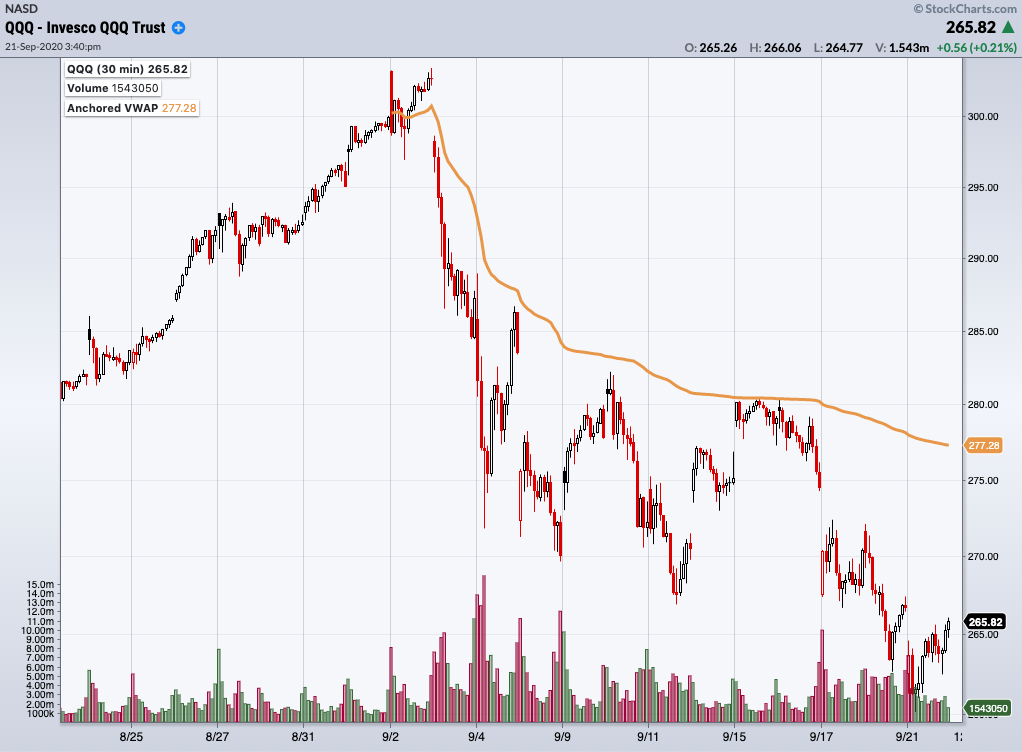
Click here for a live version of this chart.
Check out our Anchored VWAP deep dive video featuring Brian Shannon of Alphatrends, or just read on to learn more about this technical overlay.
How Do You Calculate the Anchored VWAP?
The Anchored VWAP is calculated using the same formula as traditional VWAP. The only difference is in the bars that are included in the calculations.
- With traditional VWAP, the calculation starts with the first bar of the day and ends with the last bar of the day. Because it only incorporates one trading day of data, traditional VWAP can only be used on intraday charts.
- With Anchored VWAP, the chartist chooses the first bar to use in the calculation (“anchoring” the indicator to that bar), and the last bar is always the most recent bar available. Because of the more flexible starting and ending points, Anchored VWAP is not limited to intraday charts.
Please see our VWAP article in ChartSchool for more details on the standard formula used to calculate both VWAP and Anchored VWAP.
Learn More: VWAP Calculation
How Do You Interpret the Anchored VWAP?
Like traditional VWAP, the Anchored VWAP overlay can confirm trends and identify areas of support and resistance on the price chart. The advantage of using Anchored VWAP is that you can set the starting point to include only relevant data on your chart.
Typically, the chartist chooses a particular event as the starting price bar for the overlay: a significant high or low, an earnings announcement, a gap, etc. These events generally signal a change in market psychology, and the price action before that change should be excluded from the calculations since it doesn't reflect the same market psychology.
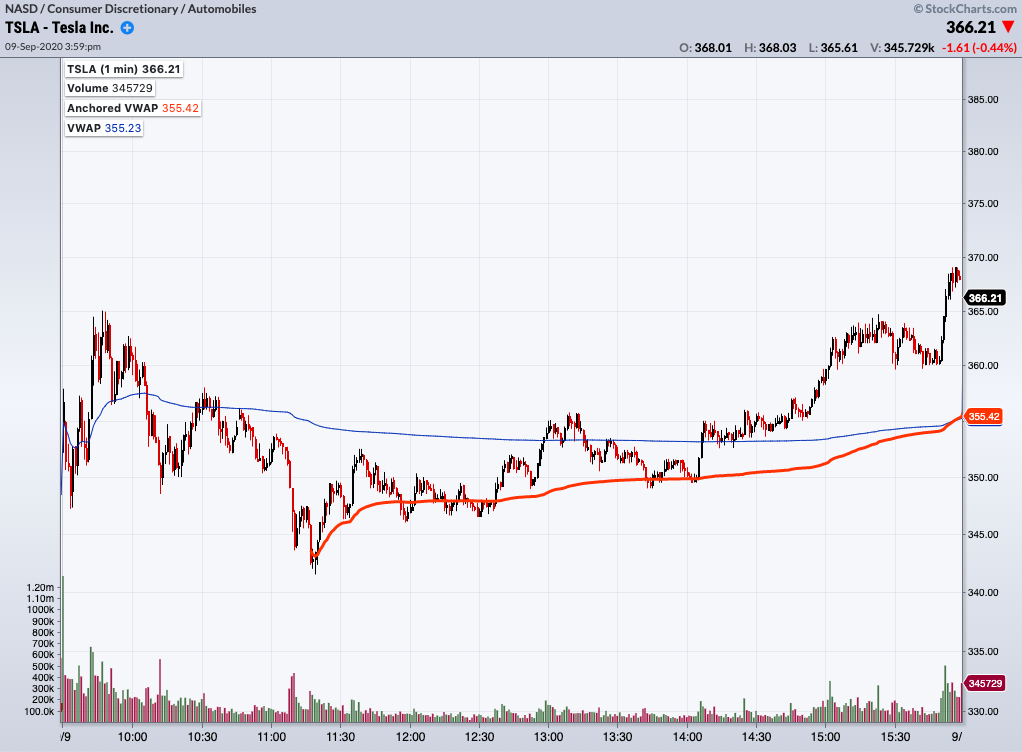
For example, in the TSLA chart below, the VWAP line (in blue) is based on the opening bar, while the Anchored VWAP line (in red) is set at the morning's low. The blue VWAP line includes data for the sharp increase in the first 20 minutes of trading, as well as the large drop to the low of the day, making for a VWAP line that doesn't reflect the price action at midday. The red Anchored VWAP line includes only data since reaching the low and more accurately reflects the midday market psychology.
Multiple Anchored VWAP lines can be used on a single chart, each anchored at a different starting point. Where multiple Anchored VWAP lines converge, that can indicate an especially strong area of support or resistance.
The Bottom Line
Anchored VWAP provides all the same benefits as traditional VWAP in defining support and resistance levels, with the added advantage that you can pinpoint the exact timeframe to study. Starting VWAP calculations at the time of a significant turning point allows you to exclude price action that was driven by a different market psychology.
As with all technical indicators, traders should use the Anchored VWAP overlay with other indicators and analysis techniques.
Charting with Anchored VWAP
This overlay can be added from the Chart Settings panel for your StockChartsACP chart.
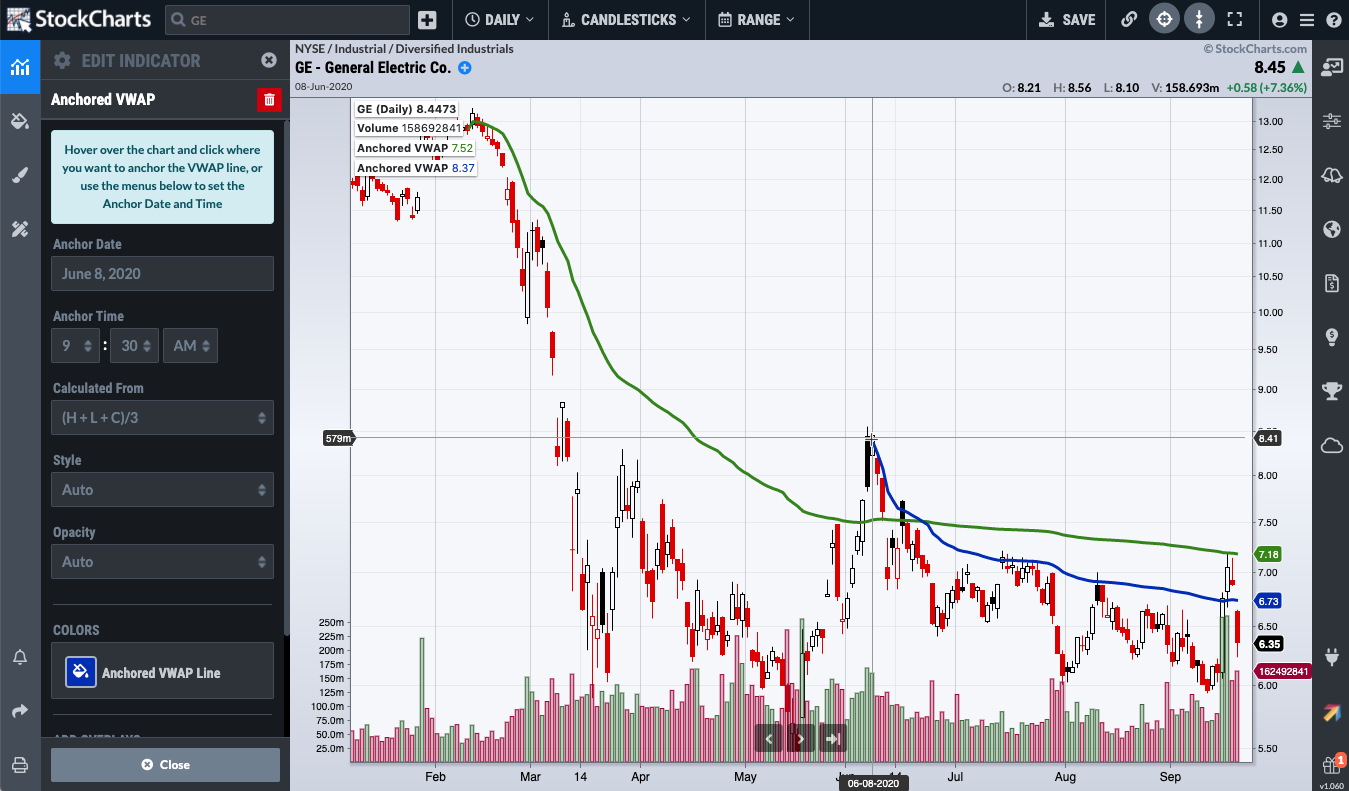
Click here for a live version of this chart.
When you add Anchored VWAP to your chart, a starting date and time will be chosen for you, but this can easily be adjusted to meet your technical analysis needs. The Anchor Date and Anchor Time fields can be edited manually, but StockCharts provides a much quicker way to update these values: simply hover over the chart, position the crosshairs on the bar where you want to start your Anchored VWAP overlay, and click on that bar to set the new Anchor Date and Anchor Time.
Anchored VWAP FAQs
How is the Anchored VWAP different from traditional VWAP?
The main difference lies in the starting point for calculations. Traditional VWAP always starts with the first bar of the day, while Anchored VWAP allows the trader to specify the price bar where the calculations begin. Because of the more flexible starting and ending points, Anchored VWAP is not limited to intraday charts.
What is the significance of the starting price bar chosen for Anchored VWAP calculations?
The starting price bar that is chosen generally marks a shift in market psychology, such as a significant high or low, earnings, news, or other announcements. This bar anchors the VWAP calculations and provides insights into whether the bulls or bears have been in charge since then.
Can multiple Anchored VWAP lines be used on a single chart?
Yes, multiple Anchored VWAP lines can be used on a single chart, each anchored at a different starting point. Where multiple Anchored VWAP lines converge, that can indicate an especially strong area of support or resistance.