|
|
Table of Contents
Aroon Oscillator
Introduction
The Aroon Oscillator is the difference between Aroon-Up and Aroon-Down. These two indicators are usually plotted together for easy comparison, but chartists can also view the difference between these two indicators with the Aroon Oscillator. This indicator fluctuates between -100 and +100 with zero as the middle line. An upward trend bias is present when the oscillator is positive, while a downward trend bias exists when the oscillator is negative. Chartists can also expand the bull-bear threshold to identify stronger signals. See our ChartSchool article for more details on Aroon-Up and Aroon-Down.
Calculation
Aroon-Up and Aroon-Down measure the number of periods since price recorded an x-day high or low. Aroon-Up is based on time and price highs. Aroon-Down is based on time and price lows. For example, 25-day Aroon-Up measures the number of days since a 25-day high, while 25-day Aroon-Down measures the number of days since a 25-day low. These indicators are shown in percentage terms and fluctuate between 0 and 100. The Aroon Oscillator is simply Aroon-Up less Aroon-Down. The default parameter in SharpCharts is 25 and the example below is based on the 25-day Aroon Oscillator.
Aroon-Up = 100 x (25 - Days Since 25-day High)/25
Aroon-Down = 100 x (25 - Days Since 25-day Low)/25
Aroon Oscillator = Aroon-Up  -  Aroon-Down
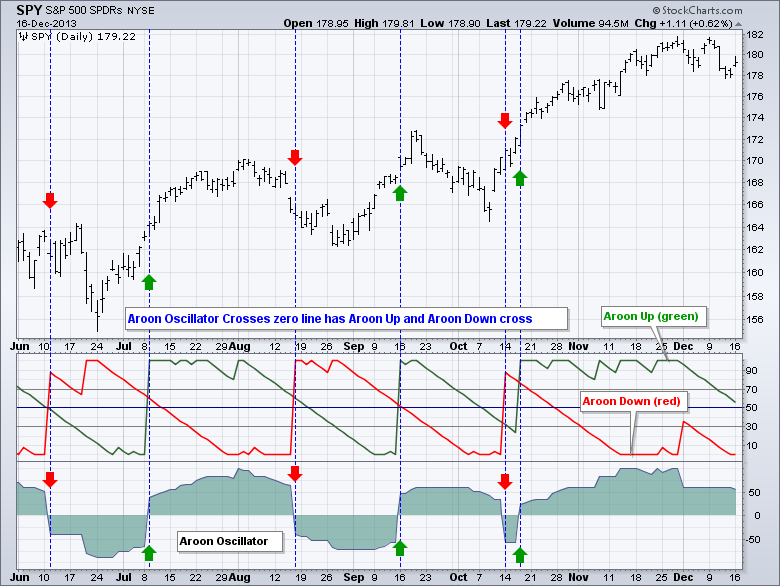
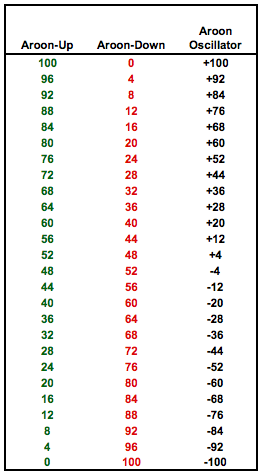
Simply crunching the numbers reveals some interesting pairings. To get above or below a certain threshold requires Aroon-Up or Aroon-Down to reach a minimum level. For example, the oscillator equals +100 when Aroon-Up equals 100 and Aroon-Down equals 0. Similarly, the Aroon Oscillator equals -100 when Aroon-Up is 0 and Aroon-Down is 100. It requires some strong upward price movement for the Aroon Oscillator to reach +100. Similarly, strong downward price movement is required for the oscillator to reach -100.
An Aroon Oscillator that equals +40 requires Aroon-Up to be at least 40, which means Aroon-Down would be 0. A positive 40 could occur from an array of Aroon-Up and Aroon-Down combinations (40-0, 44-4, 48-8, 60-20, 72-32, 80-40 or 100-60). Reverse these numbers to see possible combinations that will produce a negative 40.
In general, a relatively high positive number requires Aroon-Up to be relatively high, while a relatively low negative number requires Aroon-Down to be relatively high. The table below shows an array of Aroon-Up and Aroon-Down pairings to form the Aroon Oscillator.
Interpretation
A reading above zero means that Aroon-Up is greater than Aroon-Down, which implies that prices are making new highs more recently than new lows. Conversely, readings below zero indicate that Aroon-Down is greater than Aroon-Up. This implies that prices are recording new lows more recently than new highs. As you can see, the Aroon Oscillator is either going to be positive or negative for the vast majority of the time, making interpretation fairly straightforward. Time and price favor an uptrend when the indicator is positive and a downtrend when the indicator is negative. A positive or negative threshold can be used to define the strength of the trend. For example, a surge above +50 would reflect a strong upside move, while a plunge below -50 would indicate a strong downside move.
General Trend Bias
Defining a general trend bias is the most basic use for the Aroon Oscillator. The indicator will remain in positive territory during strong uptrends and in negative territory during strong downtrends. Depending on the parameters, short trends or choppy trading can cause the indicator to move above/below zero quite often. The chart below shows Disney with two different Aroon Oscillator settings: 25 days and 75 days. 25-day Aroon was much more sensitive than 75-day Aroon. Notice that 25-day Aroon crossed the zero line over eight times in eighteen months. 75-day Aroon crossed the zero line just four times. Chartists must decide their timeframe and choose the setting that best captures this timeframe. Short-term traders would clearly opt for a 25-day Aroon or shorter, while position traders looking for 2-4 month moves would opt for 75-day Aroon.
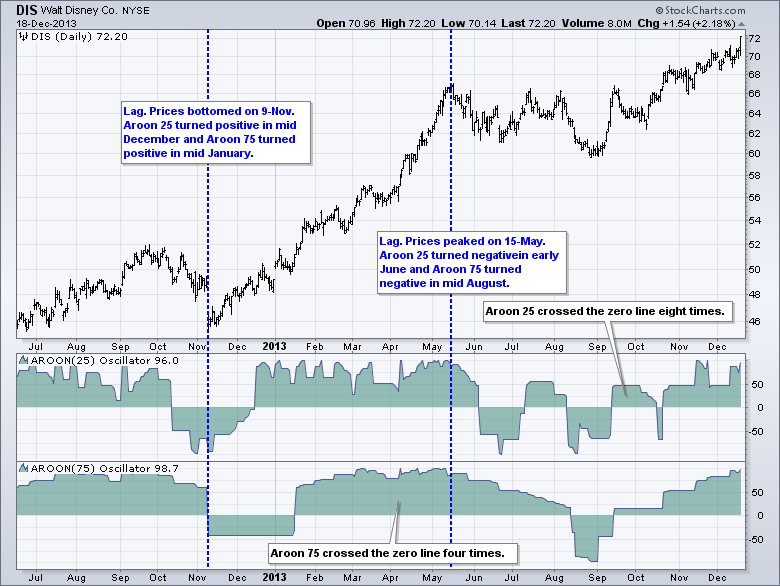
The chart also shows that the Aroon Oscillator is not immune to lag as the oscillator turns positive or negative after prices have already moved. The longer the parameter setting, the more the lag. Do not expect to pick bottoms or tops with positive or negative crossovers. As more of a trend following indicator, the Aroon Oscillator identifies moves that may be strong enough to signal the start of a sustained trend, though not all trends extend.
Strong Trend Bias
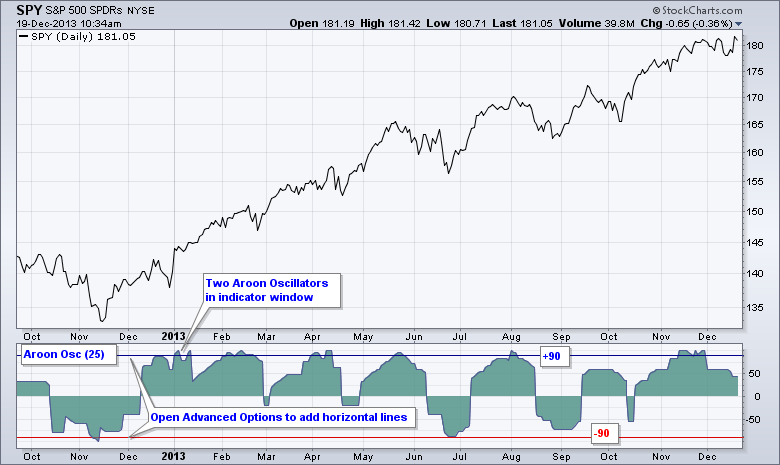
Chartists can expand the bullish and bearish parameters to further filter signals. Widening the parameters will produce signals with more lag and a longer time horizon. For example, the bullish threshold could be set at +90 and the bearish threshold at -90. A +90 would indicate that Aroon-Up is between 90 and 100, while Aroon-Down is between 0 and 10. The opposite is true for a reading below -90. Such strong readings occur after a significant move that can foreshadow the beginning of an extended trend. A move above +90 is considered bullish until negated with a move below -90. This level is deep enough to absorb most pullbacks within an uptrend. Similarly, a move below -90 is deemed strong enough to signal the start of an extended decline. This signal is not reversed until there is a move above +90, which is high enough to absorb most oversold bounces.
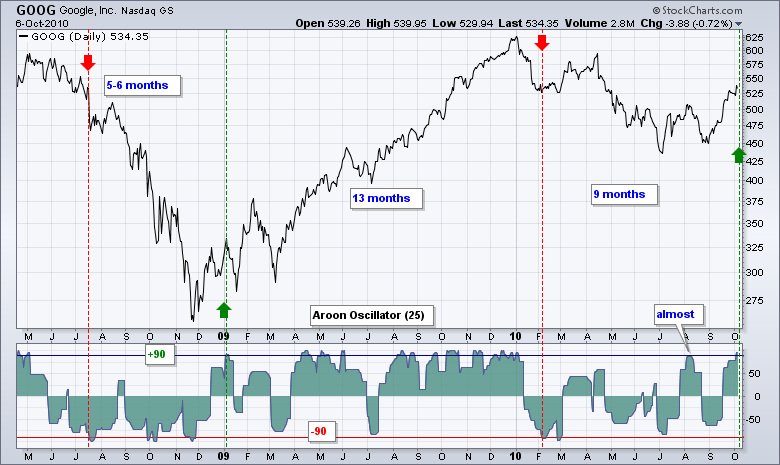
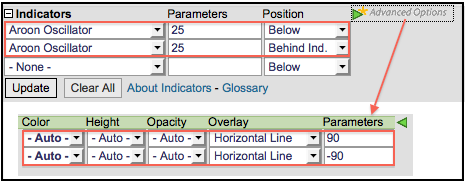
The Google (GOOG) chart shows the Aroon Oscillator(25) with horizontal lines at +90 and -90. The indicator was added twice and “advanced options” were used to add the horizontal lines. A live example is shown in the SharpCharts section below. Even though these signals lag, they last longer than a simple zero line crossover. Clearly, these signals are not going to pick bottoms or tops because they occur after a significant move. Also, notice how Google moved counter to the signals just after they were given. There were two sharp pullbacks after the bullish signal in January 2009. The trend continued in the direction of the signal after each counter-trend move.
These 90/90 signals can be used to establish the big trend and then trade in the direction of that trend. For example, chartists can focus exclusively on bullish signals when the big trend is up (Aroon > +90). Conversely, chartists can focus exclusively on bearish signals when the big trend is down (Aroon < -90). Chartists can even tweak the bullish and bearish thresholds, though they are advised not to over-fit.
Conclusion
The Aroon Oscillator merges the Aroon-Up and Aroon-Down indicators into one indicator. This makes it easy to identify the stronger of the two. The oscillator is positive when Aroon-Up is stronger than Aroon-Down and negative when Aroon-Down is stronger than Aroon-Up. A general bullish bias is present when the oscillator is positive and a bearish bias exists when negative. It is tempting to look for bullish and bearish divergences, but the indicator was not designed for traditional oscillator signals. As with all technical indicators, the Aroon Oscillator should be used in conjunction with other aspects of technical analysis, such as chart pattern analysis or momentum indicators.
Using with SharpCharts
The Aroon Oscillator is available on SharpCharts as an indicator that can be positioned above, below or behind the price plot of the underlying security. As noted above, users can add two Aroon Oscillators with the same parameters and then click the green arrow for advanced options. Horizontal lines can then be added to set the bullish and bearish thresholds. These thresholds may vary according to the characteristics of the underlying security. SharpCharts subscribers can even save this chart to their favorites list by clicking the “add new” link at the top-right of the chart. Click here for a live chart with the Aroon Oscillator.
Suggested Scans
Aroon Oscillator Crosses above Zero
This simple scan searches for stocks where the Aroon Oscillator crossed from negative territory to positive territory and daily volume was above the 50-day moving average of volume. In other words, the bullish crossover occurred with expanding volume.
[type = stock] AND [country = US]
AND [Daily SMA(20,Daily Volume) > 100000]
AND [Daily SMA(60,Daily Close) > 20]

AND [Daily Aroon Osc(25) crosses 0]
AND [Daily Volume > Daily SMA(50,Daily Volume)]
Aroon Oscillator Crosses below Zero
This simple scan searches for stocks where the Aroon Oscillator crossed from positive territory to negative territory and daily volume was above the 50-day moving average of volume. In other words, the bearish crossover occurred with expanding volume.
[type = stock] AND [country = US]
AND [Daily SMA(20,Daily Volume) > 100000]
AND [Daily SMA(60,Daily Close) > 20]

AND [0 crosses Daily Aroon Osc(25)]
AND [Daily Volume > Daily SMA(50,Daily Volume)]
For more details on the syntax to use for Aroon Oscillator scans, please see our Scanning Indicator Reference in the Support Center.
