
|
Table of Contents
Balance of Power (BOP)
Introduction
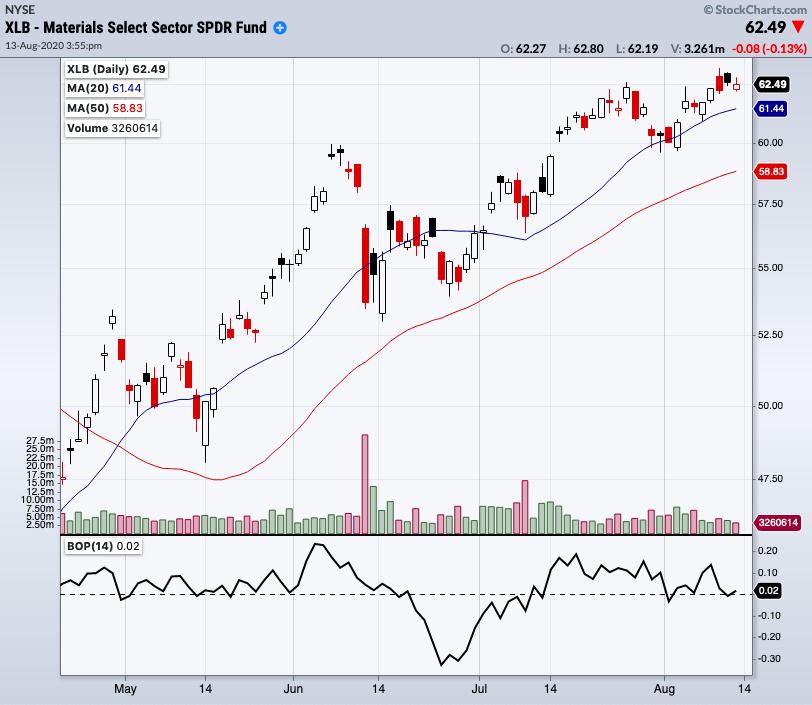
Balance of Power (BOP) is an oscillator that measures the strength of buying and selling pressure. Introduced by Igor Levshin in the August 2001 issue of Technical Analysis of Stocks & Commodities magazine, this indicator compares the power of buyers to push prices to higher extremes with the power of sellers to move prices to lower extremes. When the indicator is in positive territory, the bulls are in charge; and sellers dominate when the indicator is negative. A reading near the zero line indicates a balance between the two and can mean a trend reversal.
Note: This indicator is sometimes referred to as Balance of Market Power (BMP).
Calculation
Livshin's original calculation method for the Balance of Power indicator is fairly complex, but can be reduced to a much simpler formula:
BOP = (Close - Open) / (High - Low)
Of course, using these raw daily values makes for a choppy oscillator, so the values are typically smoothed with a moving average. Livshin recommends smoothing with a 14-period SMA, but the number of periods can be modified to fit the timeframe being charted.
The resulting indicator oscillates between -1 and +1. A positive value indicates a Security that is closing above its open; the higher the value, the more extreme the positive price change. A maximum value of +1 would indicate that the security opened at the low and closed at the high value for every time period included in the moving average.
Interpretation
The Balance of Power indicator shows the direction and extent of price change during the trading period. Like most oscillators, the Balance of Power indicator can be used to identify trends, divergences from price, and overbought/oversold conditions. Zero-line crossovers provide buying and selling signals.
Zero-Line Crossovers
The scale of this oscillator ranges from -1 to +1, with 0 as the centerline. Zero-line crossovers indicate a move into positive or negative territory, and are often used as buy or sell signals. A cross above the center line generates a buy signal, and a cross below generates a sell signal.
The data is smoothed with a moving average in order to reduce the number of whipsaws. An SMA with more periods reduces the number of false crossover signals, but also reduces the responsiveness of the indicator.
While the main signal provided by the Balance of Power indicator comes from zero-line crossovers, it can also be used to determine the trend, look for divergences in price, and identify overbought/oversold securities.
Trend identification
A rising BOP line indicates an upward trend and a falling BOP line indicates a downward trend. The zero-line crossover confirms the trend change.
Divergences with Price
When price makes new highs but BOP doesn't, that is a negative divergence; when price makes new lows but BOP doesn't, that is a positive divergence. These divergences can foreshadow a change in trend.
Overbought/Oversold Conditions
Chartists will need to look at historical levels for the security they are studying to determine what should be considered overbought/oversold for that security. Once those overbought/oversold levels have been established for that security, then look for dips beyond those levels.
Conclusion
The Balance of Power (BOP) indicator uses price to measure buying and selling pressure. It determines the strength of the buyers and sellers by looking at how strongly the price has changed, rather than using volume.
Zero-line crossovers of the BOP indicator can be used as a signal for trend reversals. In addition, indicator trends, divergences with price, and extreme overbought/oversold levels can give clues about the current price trend and the possibility of a price trend reversal.
As with all indicators, traders should use the Balance of Power indicator in conjunction with other indicators and analysis techniques.
Charting with the Balance of Power Indicator
The Balance of Power indicator can be charted on StockChartsACP after installing our free Advanced Indicator Pack. Please see our StockChartsACP Plug-Ins article in the Support Center for more information on installing this plug-in.
Once the plug-in is installed, the Balance of Power indicator can be added from the Chart Settings panel for your StockChartsACP chart. The indicator can be positioned above, below, or behind the security's price plot.
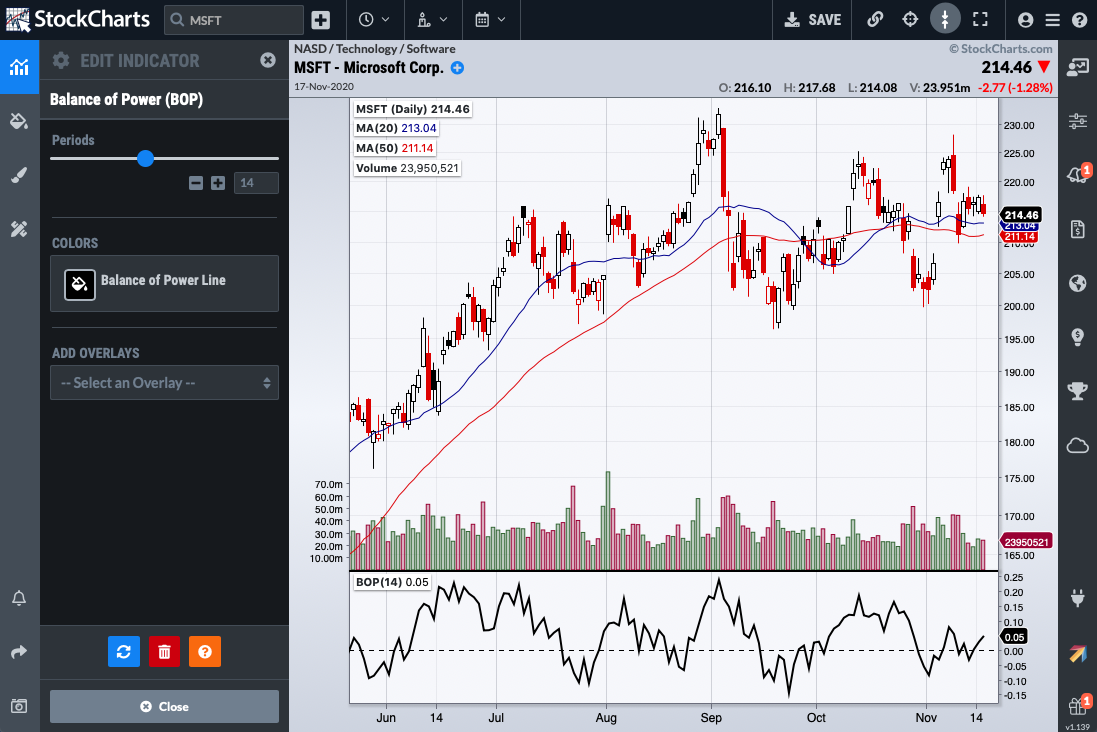
By default, the indicator is smoothed with a 14-period SMA, but the number of periods can be adjusted to meet your technical analysis needs.
Scanning for BOP
StockCharts members can screen for stocks based on Balance of Power (BOP) values. Below are some example scans that can be used for BOP-based signals. Simply copy the scan text and paste it into the Scan Criteria box in the Advanced Scan Workbench.
Members can also set up alerts to notify them when a BOP-based signal is triggered for a stock. Alerts use the same syntax as scans, so the sample scans below can be used as a starting point for setting up alerts as well. Simply copy the scan text and paste it into the Alert Criteria box in the Technical Alert Workbench.
Bullish Zero-Line Crossover
This scan reveals stocks where the Balance of Power indicator crosses above zero, which is a bullish sign. This scan is just a starting point. Further refinement and analysis are required.
[type = stock] AND [country = US]
AND [Daily SMA(20,Daily Volume) > 40000]
AND [Daily SMA(60,Daily Close) > 20]

AND [BOP(14) x 0]
Bearish Zero-Line Crossover
This scan reveals stocks where the Balance of Power indicator crosses below zero, which is a bearish sign. This scan is just a starting point. Further refinement and analysis are required.
[type = stock] AND [country = US]
AND [Daily SMA(20,Daily Volume) > 40000]
AND [Daily SMA(60,Daily Close) > 20]

AND [0 x BOP(14)]
For more details on the syntax to use for Balance of Power scans, please see our Scan Syntax Reference in the Support Center.
Additional Resources
Stocks & Commodities Magazine Articles
Balance of Market Power by Igor Livshin
Aug 2001 - Stocks & Commodities V.19:8 (18-32)