
|
Table of Contents
Double Exponential Moving Average (DEMA)
What Is the Double Exponential Moving Average (DEMA) Indicator?
The Double Exponential Moving Average (DEMA) is a technical indicator that reduces the lag of traditional Exponential Moving Averages (EMAs), making it more responsive. It uses the lag difference between a single-smoothed EMA and a double-smoothed EMA to offset the single-smoothed EMA, producing a moving average that stays closer to the price bars than traditional EMAs.
DEMA was developed by Patrick Mulloy, and introduced in the January 1994 issue of Technical Analysis of Stocks & Commodities magazine.
The overlay uses the lag difference between a single-smoothed EMA and a double-smoothed EMA to offset the single-smoothed EMA. This offset produces a moving average that remains smooth, but stays closer to the price bars than either the single- or double-smoothed traditional EMA.
How Do You Calculate DEMA?
Single- and Double-Smoothed EMAs:
  EMA1 = EMA of price
  EMA2 = EMA of EMA1
DEMA = (2 x EMA1) - EMA2
The formula takes the lag difference between the somewhat lagging single-smoothed EMA1 and the even more lagging double-smoothed EMA2, then subtracts that difference from EMA1. This calculation produces a smoothed line that is much closer to the price bars than either EMA1 or EMA2.
How Do You Interpret DEMA?
DEMA is interpreted in a similar way to traditional EMAs, but responds more quickly. Like other EMAs, it can be used to confirm a trend or spot a change in a trend.
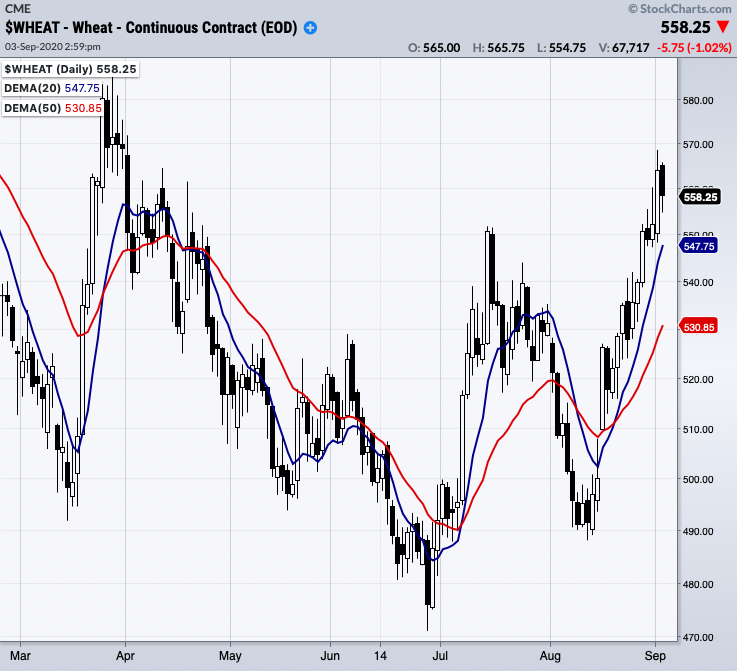
The most commonly-used signal is the DEMA crossover. Watch for the DEMA line to cross the price bars or for a shorter-term DEMA to cross a longer-term DEMA to indicate a change in trend. For example, the 20-day DEMA crossing above the 50-day DEMA would be a bullish signal.
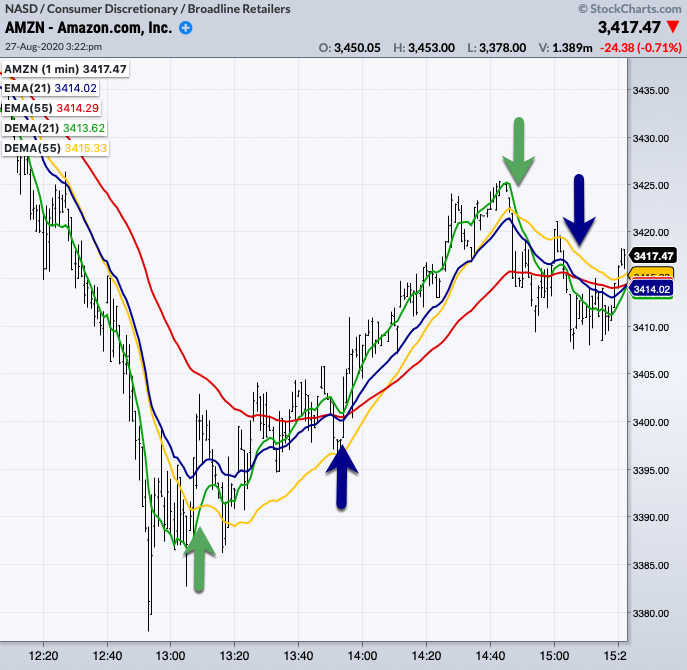
These DEMA crossovers (whether of price or another DEMA) typically happen much earlier than the corresponding traditional EMA crossover. In the example below, the green arrows mark DEMA crossovers, and the blue arrows mark the corresponding EMA crossovers. In both cases, the DEMA crossover happens before the EMA crossover.
Just so you know, because DEMA reacts more quickly than traditional EMAs, your trading strategies may need to be adjusted for use with DEMA.
The Bottom Line
Price crossovers and other signals generally occur sooner with DEMA than with traditional EMAs. The reduced lag and greater responsiveness of DEMA appeal to short-term investors, but long-term investors may find traditional moving averages more useful. As with all technical indicators, traders should use DEMA with other indicators and analysis techniques.
Charting with DEMA
The DEMA overlay can be charted on StockChartsACP after installing our free Advanced Indicator Pack. Please see our StockChartsACP Plug-Ins article in the Support Center for more information on installing this plug-in.
Once the plug-in is installed, the DEMA overlay can be added from the Chart Settings panel for your StockChartsACP chart. DEMA can be overlaid on the security's price plot or on an indicator panel.
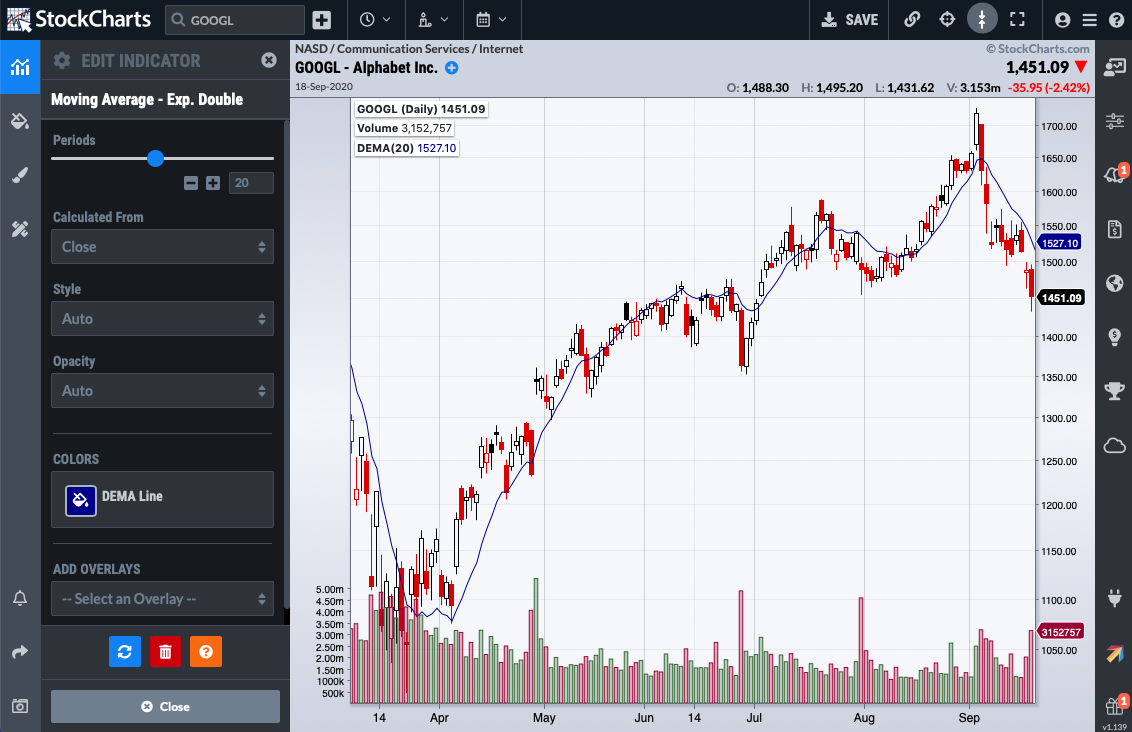
Click here for a live version of this chart.
By default, the moving average is calculated with 20 periods, but the number of periods can be adjusted to meet your technical analysis needs.
Scanning for DEMA
StockCharts members can screen for stocks based on DEMA values. Below are some example scans that can be used for DEMA-based signals. Simply copy the scan text and paste it into the Scan Criteria box in the Advanced Scan Workbench.
Members can also set up alerts to notify them when a DEMA-based signal is triggered for a stock. Alerts use the same syntax as scans, so the sample scans below can be used as a starting point for setting up alerts as well. Simply copy the scan text and paste it into the Alert Criteria box in the Technical Alert Workbench.
Bullish DEMA Crossover
This scan looks for stocks with a rising 150-day simple moving average and a bullish cross of the 5-day DEMA and 35-day DEMA. The 150-day moving average is rising as long as it is trading above its level five days ago. A bullish cross occurs when the 5-day DEMA moves above the 35-day DEMA on above-average volume.
[type = stock] AND [country = US]
AND [SMA(20,Volume) > 40000]
AND [SMA(60,Close) > 20]

AND [SMA(150,Close) > 5 days ago SMA(150,Close)]
AND [DEMA(5,Close) > DEMA(35,Close)]
AND [Yesterday's DEMA(5,Close) < Yesterday's DEMA(35,Close)]
AND [Volume > SMA(200,Volume)]
Bearish DEMA Crossover
This scan looks for stocks with a falling 150-day simple moving average and a bearish cross of the 5-day DEMA and 35-day DEMA. The 150-day moving average is falling as long as it is trading below its level five days ago. A bearish cross occurs when the 5-day DEMA moves below the 35-day DEMA on above-average volume.
[type = stock] AND [country = US]
AND [SMA(20,Volume) > 40000]
AND [SMA(60,Close) > 20]

AND [SMA(150,Close) < 5 days ago SMA(150,Close)]
AND [DEMA(5,Close) < DEMA(35,Close)]
AND [Yesterday's DEMA(5,Close) > Yesterday's DEMA(35,Close)]
AND [Volume > SMA(200,Volume)]
For more details on the syntax to use for DEMA scans, please see our Scanning Indicator Reference in the Support Center.
DEMA FAQs
How does DEMA differ from traditional EMAs?
DEMA reduces the lag of traditional EMAs, making it more responsive and closer to the price bars. DEMA crossovers typically happen much earlier than the corresponding traditional EMA crossover.
Who is DEMA most suited for?
DEMA is well-suited for short-term traders due to its reduced lag and increased responsiveness. Long-term investors, however, may find traditional moving averages more useful.
Do I need to adjust my trading strategies for use with DEMA?
Yes, because DEMA reacts more quickly than traditional EMAs, you may need to adjust your trading strategies accordingly.
What are the potential signals given by DEMA?
The most common signal is the DEMA crossover, indicating a change in trend. Price crossovers and other signals generally occur sooner with DEMA than with traditional EMAs.
What is a DEMA crossover?
A DEMA crossover occurs when the DEMA line crosses the price bars or when a shorter-term DEMA crosses a longer-term DEMA. This indicates a change in trend. For example, a 20-day DEMA crossing above the 50-day DEMA would be a bullish signal.
Additional Resources
Stocks & Commodities Magazine Articles
Smoothing Data With Faster Moving Averages by Patrick G. Mulloy
Jan 1994 - Stocks & Commodities V.12:1 (11-19)