|
|
This is an old revision of the document!
Table of Contents
Ease of Movement
Introduction
Developed by Richard Arms, Ease of Movement (EMV) is a volume-based oscillator that fluctuates above and below the zero line. As its name implies, it is designed to measure the “ease” of price movement. Arms created EquiVolume charts to visually display price ranges and volume. Ease of Movement takes EquiVolume to the next level by quantifying the price/volume relationship and showing the results as an oscillator. In general, prices are advancing with relative ease when the oscillator is in positive territory. Conversely, prices are declining with relative ease when the oscillator is in negative territory.
SharpCharts Calculation
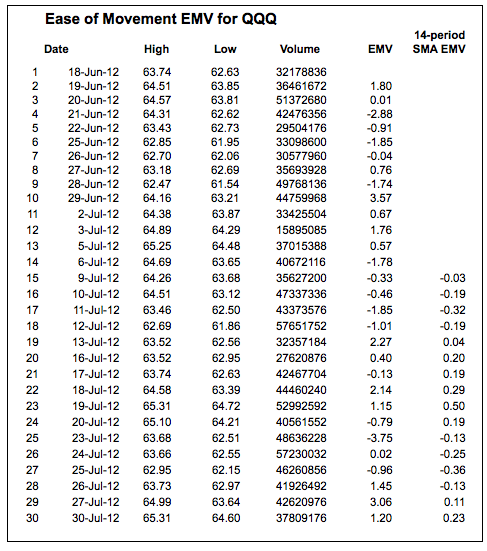
There are three parts to the EMV formula: distance moved, volume and the high-low range. First, the distance moved is calculated by comparing the current period's midpoint with the prior period's midpoint, which is the high plus the low divided by two. Distance moved is positive when the current midpoint is above the prior midpoint and negative when the current midpoint is below the prior midpoint. Distance moved is shown as the numerator in the formula below.
Distance Moved = ((H + L)/2 - (Prior H + Prior L)/2)

Box Ratio = ((V/100,000,000)/(H - L))

1-Period EMV = ((H + L)/2 - (Prior H + Prior L)/2) / ((V/100,000,000)/(H - L))

14-Period Ease of Movement = 14-Period simple moving average of 1-period EMV
The other two parts form the Box ratio, which uses volume and the high-low range. EquiVolume charts are based on volume and the high-low range as well. The Box ratio is the denominator of EMV. Note that volume is divided by 100,000,000 to keep it relevant with the other numbers.
Relatively low volume and a relatively large high-low range will produce a smaller denominator (Box ratio), which means the EMV value will be larger because of division by a smaller number. The Box ratio would be .50 if V/10000000 equals 2 and the high-low range equals 4. A wide range on low volume implies relatively easy price movement. In other words, it did not take much volume to move prices.
A relatively small high-low range on high volume would produce a larger denominator, which means the EMV value will be smaller. The denominator would be 2 if V/10000000 equals 4 and the high-low range equals 2. This implies that price movement was difficult because there was a relatively small high-low range on big volume.
Interpretation
The example below shows the Nasdaq 100 ETF (QQQ) with the 1-period EMV in the lower indicator window. I am using EquiVolume bars because these show only the high-low range for the given period. The blue arrows show two small EMV values, one slightly positive and the other slightly negative. Volume on both days was above average, but the high-low range was modest or even small. This means prices had difficulty moving even though volume was relatively high.
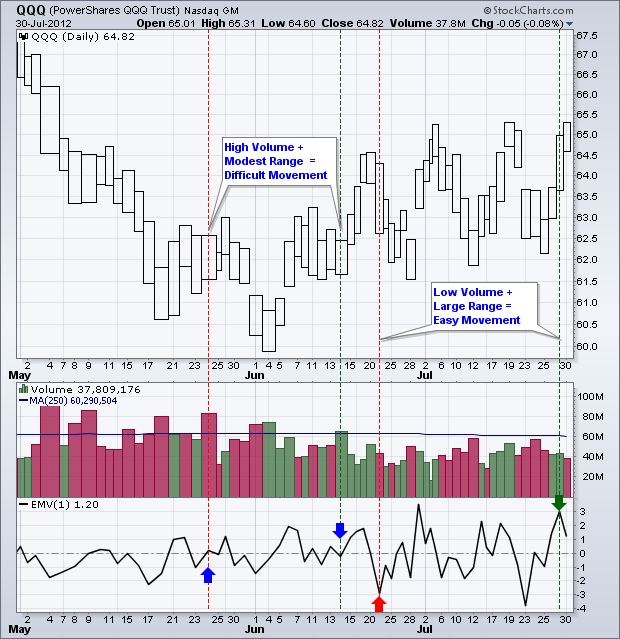
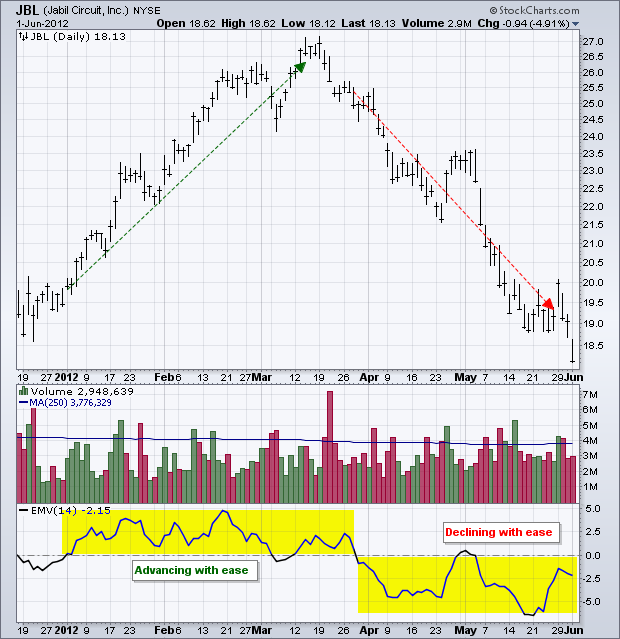
The red arrow shows an EMV value near -3, which is very negative. This is because volume was low and the high-low range was large. This implies that prices declined with relative ease and there was little or no buying pressure. The green arrow shows an EMV value near +3. Again, volume was low and the high-low range was large. This means prices advanced with relative ease and there was little or no selling pressure. The chart below shows Jabil Circuit (JBL) with the 14-period Ease of Movement indicator. This is just a 14-period simple moving average of each period's EMV value.
Confirming Other Signals
Ease of Movement is best used to confirm other indicators or chart analysis. In other words, it is not a standalone indicator. Keep in mind that the “Distance Moved” portion of the formula is the positive/negative driver. EMV is generally positive when the midpoint rises and negative when the midpoint falls. This means EMV will generally rise and fall along with the price of the underlying security. The amount of this rise or fall depends on the Box ratio. Chartists can use EMV to confirm a breakout on the price chart or a bullish indicator signal. Conversely, a move into negative territory can be used to confirm a breakdown on the price chart or a bearish indicator signal.
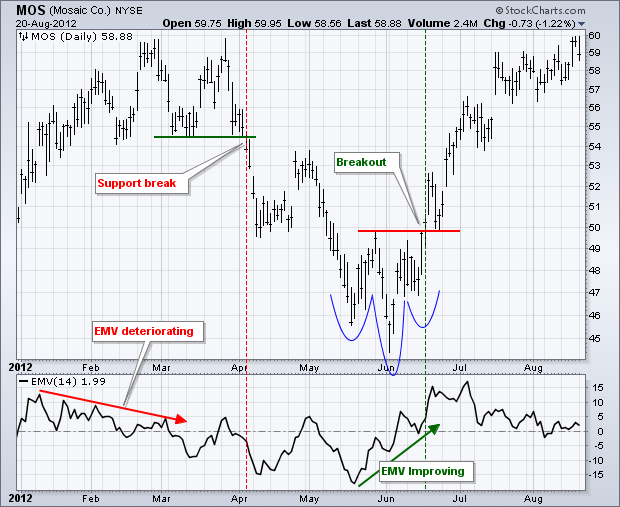
The example above shows Mosaic (MOS) with a bearish breakdown in early April and a bullish breakout in mid-June. Prior to the bearish breakdown, EMV deteriorated for two months and dipped into negative territory in March. With the stock rising and EMV declining in January-February, the advance was becoming more laborious (difficult). MOS broke support with a decline in early April and EMV confirmed with another dip into negative territory. After negative readings for most of April and May, EMV improved from late May to early June with a move into positive territory. The stock also formed a small inverse head-and-shoulders and broke resistance at 50.
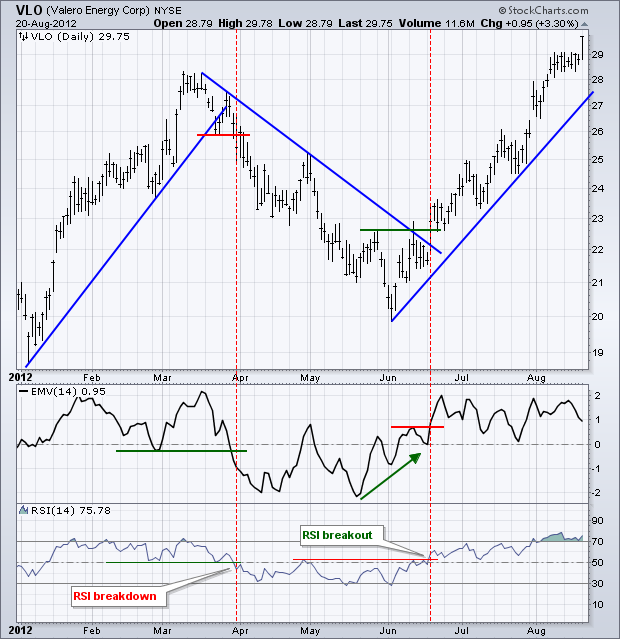
The second example shows Valero Energy (VLO) with EMV signals confirmed by RSI and the price chart. After advancing from January to mid-March, VLO reversed course and broke support at the end of March. Notice that EMV broke its late February low and moved deep into negative territory at the end of March. Additionally, RSI broke to its lowest level since early January. The second reversal occurred when VLO broke resistance in mid-July. EMV began to improve before this breakout and was firmly positive at the time of the breakout. RSI also confirmed with a break above its April high and a move above 55.
Conclusion
Ease of Movement (EMV) combines price direction with volume to create a volume-based momentum oscillator. Because it is closely tied with price changes, EMV tends to track the price of the underlying security quite closely. For the most part, EMV is used to confirm signals derived from the price chart or other indicators. Chartists looking for a smoother EMV line can lengthen the look-back period.
Using with SharpCharts
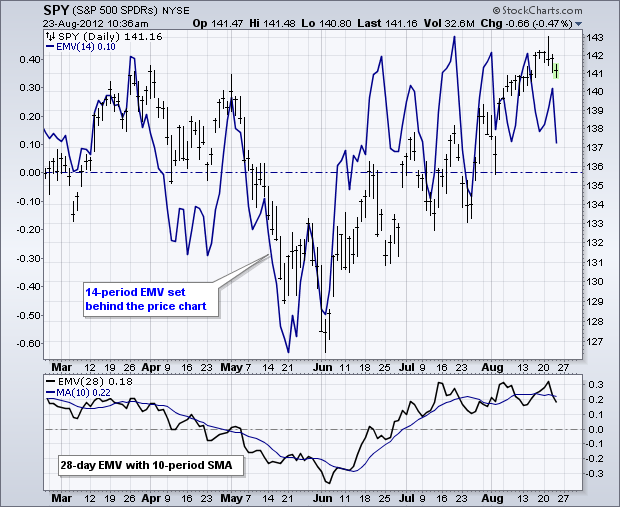
Ease of Movement (EMV) can be found in the “indicators” section under the chart. Users can adjust the settings by changing the numbers in the “parameters” box. The indicator can then be positioned “behind price,” “above” the main window or “below” the main window. It helps to change the color when placing it behind the price. Chartists can also add a moving average using the “advanced” indicator options.

Suggested Scans
EMV Crosses above Zero
This simple scan searches for stocks where the EMV crossed from negative territory to positive territory.
[type = stock] AND [country = US]
AND [Daily SMA(20,Daily Volume) > 100000]
AND [Daily SMA(60,Daily Close) > 20]

AND [Daily EMV(14) crosses 0]
EMV Crosses below Zero
This simple scan searches for stocks where the EMV crossed from positive territory to negative territory.
[type = stock] AND [country = US]
AND [Daily SMA(20,Daily Volume) > 100000]
AND [Daily SMA(60,Daily Close) > 20]

AND [0 crosses Daily EMV(14)]
For more details on the syntax to use for Ease of Movement scans, please see our Scanning Indicator Reference in the Support Center.
Further Study
In addition to his book Profits in Volume, Richard Arms Jr. has a website with more information on EquiVolume, including the downloadable ebook Trading with EquiVolume.

