
|
Table of Contents
Hull Moving Average (HMA)
Introduction
The Hull Moving Average (HMA) attempts to minimize the lag of a traditional moving average while retaining the smoothness of the moving average line. Developed by Alan Hull in 2005, this indicator makes use of weighted moving averages to prioritize more recent values and greatly reduce lag. The resulting average is more responsive and well-suited for identifying entry points.
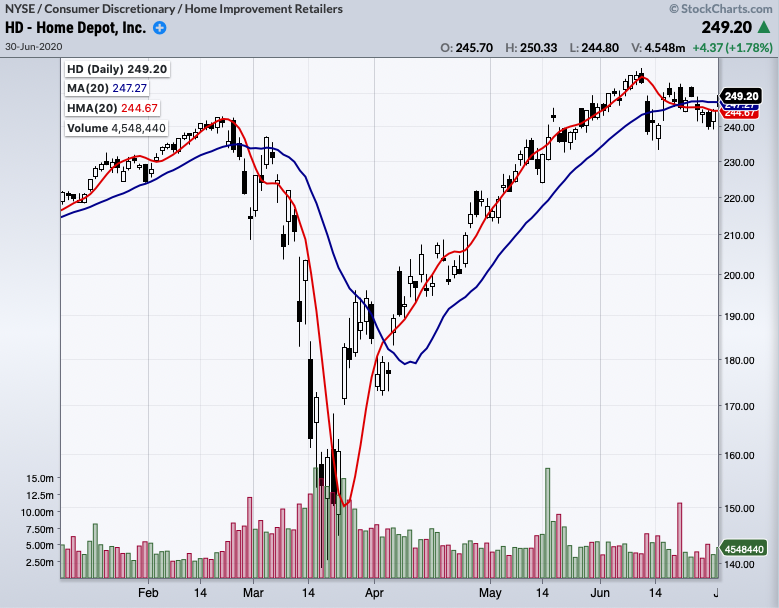
Notice in the example below that the HMA line (in red) turns more quickly and decisively than the corresponding SMA (in blue).
Hull Moving Average Calculation
The formula for the Hull Moving Average uses two different weighted moving averages (WMAs) of price, plus a third WMA to smooth the raw moving average. There are three parts to the calculation. In the formulas listed below, “n” indicates the number of periods specified by the chartist.
First, calculate two WMAs: one with the specified number of periods and one with half the specified number of periods.
WMA1 = WMA(n/2) of price
WMA2 = WMA(n) of price
Second, calculate the raw (non-smoothed) Hull Moving Average.
Raw HMA = (2 * WMA1) - WMA2
Third, smooth the raw HMA with another WMA, this one with the square root of the specified number of periods.
HMA = WMA(sqrt(n)) of Raw HMA
Of course, when you divide a whole number by two or calculate its square root, you don't always end up with a whole number as a result. In that case, we round the result to the nearest whole number, so we can use that as the number of periods when calculating weighted moving averages.
For example, when calculating an 11-day HMA, we end up with non-whole numbers for two of our WMAs. For calculating the n/2 WMA, 11/2 is 5.5, so we would round that up to 6 for the WMA calculation. For the sqrt(n) WMA, the square root of 11 is 3.317, so we would round that down to 3 for the number of WMA periods in the final smoothing calculation.
How do these calculations reduce lag?
- Weighted moving averages inherently reduce lag by placing additional weight on more recent values.
- Lag is further reduced by offsetting one WMA with another WMA that covers only the most recent half of the specified timeframe, putting even more focus on recent values.
- The final smoothing uses another WMA with even fewer periods (the square root of the number of periods in the specified timeframe), further weighting towards the most recent data.
The end result is a smooth moving average line that stays very close to the price bars.
Interpreting the Hull Moving Average
The Hull Moving Average can be interpreted in a similar way to traditional moving averages, but it responds more quickly. Like other moving averages, it can be used to confirm a trend or spot a change in the trend.
HMAs with shorter periods are often used to identify entry points. When the overall trend is up and the HMA turns up, this is a signal to buy long. Conversely, when the overall trend is down and the HMA turns down, this is a signal to buy short.
Although crossover signals (e.g. where a shorter-term MA crosses a longer-term MA) are popular with many types of moving averages, HMA creator Alan Hull does not recommend using crossovers with HMAs, because that technique depends on looking at differences in lag between the two moving averages, and the lag has already been greatly reduced in Hull Moving Averages. Instead, he recommends looking at turning points to identify entries and exits, as outlined above.
In addition, HMAs with longer periods (e.g. 200-period HMA) can be used to identify the current overall trend. If the HMA is rising, the overall trend is up; if the HMA is falling, the overall trend is down.
Conclusion
The Hull Moving Average (HMA) overlay is designed to minimize the lag present in traditional moving averages. Short-term traders can look for turning points in the average to identify entry/exit points. Longer-term HMAs can be used to identify or confirm the overall trend. As with all technical indicators, traders should use the HMA in conjunction with other indicators and analysis techniques.
Charting with the Hull Moving Average (HMA)
The HMA overlay can be charted on StockChartsACP after installing our free Advanced Indicator Pack. Please see our StockChartsACP Plug-Ins article in the Support Center for more information on installing this plug-in.
Once the plug-in is installed, the HMA overlay can be added from the Chart Settings panel for your StockChartsACP chart. HMA can be overlaid on the security's price plot or on an indicator panel.
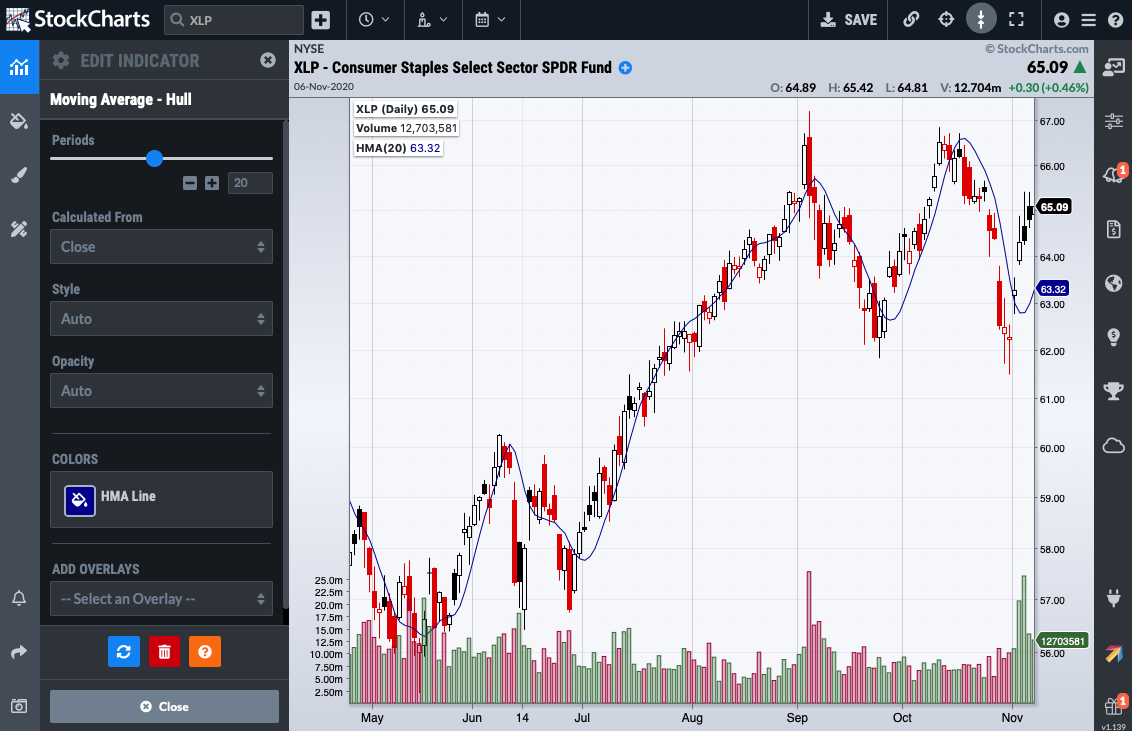
Click here for a live version of this chart.
By default, the moving average is calculated with 20 periods, but the number of periods can be adjusted to meet your technical analysis needs.
Scanning for Hull Moving Average
StockCharts members can screen for stocks based on Hull MA values. Below are some example scans that can be used for Hull MA-based signals. Simply copy the scan text and paste it into the Scan Criteria box in the Advanced Scan Workbench.
Members can also set up alerts to notify them when a Hull MA-based signal is triggered for a stock. Alerts use the same syntax as scans, so the sample scans below can be used as a starting point for setting up alerts as well. Simply copy the scan text and paste it into the Alert Criteria box in the Technical Alert Workbench.
Overall Uptrend with Price Crossing Above Hull MA
This scan starts with stocks that average 100,000 shares daily volume and have an average closing price above 10. An uptrend is present when the 50-day Hull MA is above average. A buy signal materializes when price moves above the shorter-term 20-day Hull MA.
[type = stock] AND [country = US]
AND [Daily SMA(20,Daily Volume) > 100000]
AND [Daily SMA(60,Daily Close) > 10]

AND [HullMA(50,Close) >  Daily SMA(50,HullMA(50,Close))]
AND [Daily Close crosses HullMA(20,Close)]
Overall Downtrend with Price Crossing Below Hull MA
This scan starts with stocks that average 100,000 shares daily volume and have an average closing price above 10. A downtrend is present when the 50-day Hull MA is below average. A sell signal materializes when price moves below the shorter-term 20-day Hull MA.
[type = stock] AND [country = US]
AND [Daily SMA(20,Daily Volume) > 100000]
AND [Daily SMA(60,Daily Close) > 10]

AND [HullMA(50,Close) <  Daily SMA(50,HullMA(50,Close))]
AND [HullMA(20,Close) crosses Daily Close]
For more details on the syntax to use for Hull MA scans, please see our Scanning Indicator Reference in the Support Center.