
|
This is an old revision of the document!
Table of Contents
Ichimoku Clouds
Introduction
The Ichimoku Cloud, also known as Ichimoku Kinko Hyo, is a versatile indicator that defines support and resistance, identifies trend direction, gauges momentum and provides trading signals. Ichimoku Kinko Hyo translates into “one look equilibrium chart”. With one look, chartists can identify the trend and look for potential signals within that trend. The indicator was developed by journalist Goichi Hosoda and published in his 1969 book. Even though the Ichimoku Cloud may seem complicated when viewed on the price chart, it's actually a rather straightforward indicator; the concepts are easy to understand and the signals are well-defined.
Calculation
Four of the five plots within the Ichimoku Cloud are based on the average of the high and low over a given period of time. For example, the first plot is simply an average of the 9-day high and 9-day low. Before computers were widely available, it would have been easier to calculate this high-low average rather than a 9-day moving average. The Ichimoku Cloud consists of five plots:
Tenkan-sen (Conversion Line): (9-period high + 9-period low)/2))

The default setting is 9 periods and can be adjusted. On a daily chart, this line is the midpoint of the 9-day high-low range,
which is almost two weeks.
Kijun-sen (Base Line): (26-period high + 26-period low)/2))

The default setting is 26 periods and can be adjusted. On a daily chart, this line is the midpoint of the 26-day high-low range, which is almost one month).
Senkou Span A (Leading Span A): (Conversion Line + Base Line)/2))

This is the midpoint between the Conversion Line and the Base Line. The Leading Span A forms one of the two cloud boundaries. It is referred to as "Leading" because it is plotted 26 periods in the future and forms the faster cloud boundary.
Senkou Span B (Leading Span B): (52-period high + 52-period low)/2))

On the daily chart, this line is the midpoint of the 52-day high-low range, which is a little less than 3 months. The default calculation setting is 52 periods, but can be adjusted. This value is plotted 26 periods in the future and forms the slower cloud boundary.
Chikou Span (Lagging Span): Close plotted 26 days in the past

The default setting is 26 periods, but can be adjusted.
This tutorial will use the English equivalents when explaining the various plots. The chart below shows the Dow Industrials with the Ichimoku Cloud plots. The Conversion Line (blue) is the fastest and most sensitive line. Notice that it follows price action the closest. The Base Line (red) trails the faster Conversion Line, but follows price action pretty well. The relationship between the Conversion Line and Base Line is similar to the relationship between a 9-day moving average and 26-day moving average. The 9-day is faster and more closely follows the price plot. The 26-day is slower and lags behind the 9-day. Incidentally, notice that 9 and 26 are the same periods used to calculate MACD.

Analyzing the Cloud
The cloud (Kumo) is the most prominent feature of the Ichimoku Cloud plots. The Leading Span A (green) and Leading Span B (red) form the cloud. The Leading Span A is the average of the Conversion Line and the Base Line. Because the Conversion Line and Base Line are calculated with 9 and 26 periods, respectively, the green cloud boundary moves faster than the red cloud boundary, which is the average of the 52-day high and the 52-day low. It is the same principle with moving averages. Shorter moving averages are more sensitive and faster than longer moving averages.
There are two ways to identify the overall trend using the cloud. First, the trend is up when prices are above the cloud, down when prices are below the cloud and flat when prices are in the cloud. Second, the uptrend is strengthened when the Leading Span A (green cloud line) is rising and above the Leading Span B (red cloud line). This situation produces a green cloud. Conversely, a downtrend is reinforced when the Leading Span A (green cloud line) is falling and below the Leading Span B (red cloud line). This situation produces a red cloud. Because the cloud is shifted forward 26 days, it also provides a glimpse of future support or resistance.
Chart 2 shows IBM with a focus on the uptrend and the cloud. First, notice that IBM was in an uptrend from June to January as it traded above the cloud. Second, notice how the cloud offered support in July, early October, and early November. Third, notice how the cloud provides a glimpse of future resistance. Remember, the entire cloud is shifted forward 26 days. This means it is plotted 26 days ahead of the last price point to indicate future support or resistance.

Chart 3 shows Boeing (BA) with a focus on the downtrend and the cloud. The trend changed when Boeing broke below cloud support in June. The cloud changed from green to red when the Leading Span A (green) moved below the Leading Span B (red) in July. The cloud break represented the first trend change signal, while the color change represented the second trend change signal. Notice how the cloud then acted as resistance in August and January.

Trend and Signals
Price, the Conversion Line and the Base Line are used to identify faster and more frequent signals. It is important to remember that bullish signals are reinforced when prices are above the cloud and the cloud is green. Bearish signals are reinforced when prices are below the cloud and the cloud is red. In other words, bullish signals are preferred when the bigger trend is up (prices above green cloud), while bearish signals are preferred when the bigger trend is down (prices are below red cloud). This is the essence of trading in the direction of the bigger trend. Signals that are counter to the existing trend are deemed weaker, such as short-term bullish signals within a long-term downtrend or short-term bearish signals within a long-term uptrend.
Conversion-Base Line Signals
Chart 4 shows Kimberly Clark (KMB) producing two bullish signals within an uptrend. First, the trend was up because the stock was trading above the cloud and the cloud was green. The Conversion Line dipped below the Base Line for a few days in late June to enable the setup. A bullish crossover signal was triggered when the Conversion Line moved back above the Base Line in July. The second signal occurred as the stock moved towards cloud support. The Conversion Line moved below the Base Line in September to enable the setup. Another bullish crossover signal was triggered when the Conversion Line moved back above the Base Line in October. Sometimes it is hard to determine exact Conversion Line and Base Line levels on the price chart. For reference, these numbers are displayed in the upper left-hand corner of each Sharpchart. As of the January 8 close, the Conversion Line was 62.62 (blue) and the Base Line was 63.71 (red).

Chart 5 shows AT&T (T) producing a bearish signal within a downtrend. First, the trend was down as the stock was trading below the cloud and the cloud was red. After a sideways bounce in August, the Conversion Line moved above the Base Line to enable the setup. This did not last long as the Conversion Line moved back below the Base Line to trigger a bearish signal on September 15th.

Price-Base Line Signals
Chart 6 shows Disney producing two bullish signals within an uptrend. With the stock trading above the green cloud, prices moved below the Base Line (red) to enable the setup. This move represented a short-term oversold situation within a bigger uptrend. The pullback ended when prices moved back above the Base Line to trigger the bullish signal.

Chart 7 shows DR Horton (DHI) producing two bearish signals within a downtrend. With the stock trading below the red cloud, prices bounced above the Base Line (red) to enable the setup. This move created a short-term overbought situation within a bigger downtrend. The bounce ended when prices moved back below the Base Line to trigger the bearish signal.

Signal Summary
This article features four bullish and four bearish signals derived from the Ichimoku Cloud plots. The trend-following signals focus on the cloud, while the momentum signals focus on the Turning and Base Lines. In general, movements above or below the cloud define the overall trend. Within that trend, the cloud changes color as the trend ebbs and flows. Once the trend is identified, the Conversion Line and Base Line act similar to MACD for signal generation. And finally, simple price movements above or below the Base Line can be used to generate signals.
Bullish Signals:
- Price moves above cloud (trend)
- Cloud turns from red to green (ebb-flow within trend)
- Price Moves above the Base Line (momentum)
- Conversion Line moves above Base Line (momentum)
Bearish Signals:
- Price moves below cloud (trend)
- Cloud turns from green to red (ebb-flow within trend)
- Price Moves below Base Line (momentum)
- Conversion Line moves below Base Line (momentum)
Conclusion
The Ichimoku Cloud is a comprehensive indicator designed to produce clear signals. Chartists can first determine the trend by using the cloud. Once the trend is established, appropriate signals can be determined using the price plot, Conversion Line, and Base Line. The classic signal is to look for the Conversion Line to cross the Base Line. While this signal can be effective, it can also be rare in a strong trend. More signals can be found by looking for price to cross the Base Line (or even the Conversion Line).
It is important to look for signals in the direction of the bigger trend. With the cloud offering support in an uptrend, traders should also be on alert for bullish signals when prices approach the cloud on a pullback or consolidation. Conversely, in a bigger downtrend, traders should be on alert for bearish signals when prices approach the cloud on an oversold bounce or consolidation.
The Ichimoku Cloud can also be used in conjunction with other indicators. Traders can identify the trend using the cloud and then use classic momentum oscillators to identify overbought or oversold conditions. Click here for a live example using the Ichimoku Cloud.
Using with SharpCharts
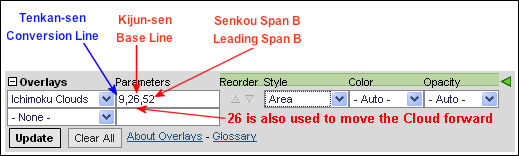
The Ichimoku Cloud indicator is available on SharpCharts by selecting it as an indicator in the “Overlay” drop-down box. Default settings are 9 for the Conversion Line, 26 for the Base Line and 52 for the Leading Span B. The Leading Span A is based on the Conversion Line and Base Line. The number for the Base Line (26) is also used to move the cloud forward (26 days). These numbers can be adjusted to suit individual trading and investing styles. Sometimes it is necessary to add extra bars to the chart when increasing the Base Line, which also increases the forward movement of the cloud.

Suggested Scans
Ichimoku Uptrend with Close above Base Line
This scan starts with a base of stocks that are averaging at least $10 in price and 100,000 daily volume over the last 60 days. Stocks are classified in an uptrend as long as Span A is above Span B and the Close is above Span B. A breakout within this uptrend occurs when price moves above the Base Line.
[type = stock] AND [country = US]
AND [Daily SMA(60,Daily Volume) > 100000]
AND [Daily SMA(60,Daily Close) > 10]

AND [Daily Close > Daily Ichimoku Span B(9,26,52)]
AND [Daily Ichimoku Span A(9,26,52) > Daily Ichimoku Span B(9,26,52)]
AND [Daily Close x Daily Ichimoku Base Line(9,26,52)]
Ichimoku Downtrend with Close below Base Line
This scan starts with a base of stocks that are averaging at least $10 in price and 100,000 daily volume over the last 60 days. Stocks are classified in a downtrend as long as Span A is below Span B and the Close is below Span A. A continuation of this downtrend could be starting when price crosses below the Base Line.
[type = stock] AND [country = US]
AND [Daily SMA(60,Daily Volume) > 100000]
AND [Daily SMA(60,Daily Close) > 10]

AND [Daily Close < Daily Ichimoku Span A(9,26,52)]
AND [Daily Ichimoku Span A(9,26,52) < Daily Ichimoku Span B(9,26,52)]
AND [Daily Ichimoku Base Line(9,26,52) x Daily Close]
For more details on the syntax to use for Ichimoku Cloud scans, please see our Scanning Indicator Reference in the Support Center.
For general instructions on Ichimoku Cloud scanning, check out our Support Center article on Scanning Ichimoku Clouds.
Further Study
| Ichimoku Charts Nicole Elliott |
 |
 |
Additional Resources
Stocks & Commodities Magazine Articles
Ichimoku Charts by Ken Muranaka
Sep 2000 - Stocks & Commodities V. 18:10 (22-30)
Ichimoku Kinko Hyo Charts by Nicole Elliott
Aug 2007 - Stocks & Commodities V. 25:9 (34-36)