
|
Table of Contents
Relative Volume (RVOL)
Introduction
The Relative Volume (RVOL) indicator compares volume data for each price bar with the average volume over a specified number of prior bars. The RVOL ratio produced allows chartists to easily spot setups where unusually high or low volume is powering a price move. When the indicator value is greater than one, the volume is higher than average; conversely, a value less than one means lower than average volume.
RVOL Calculation
The formula for RVOL is quite simple:
RVOL = current volume / average volume over the look-back period
By default, the average volume used in the formula is calculated with a 50-period simple moving average, but the number of periods as well as the type of moving average (SMA or EMA) can be modified to fit the timeframe being analyzed.
The calculation results in a ratio. So, if the RVOL value is 2.5, that means the volume for the current bar is 2.5 times the normal volume for the specified period. A value of 1.0 means the current volume is the same as the average volume.
The lower limit for this ratio is zero (where the current volume is zero). There is theoretically no upper value limit, although in practice anything over 4.0 is considered a volume spike and not a typical RVOL value.
Interpreting RVOL
Confirming the Trend
The goal of Relative Volume is to determine whether volume is higher or lower than usual for that bar, which can show how committed traders are to a price move.
In general, a higher RVOL value shows a level of commitment to the price move; the current trend will likely continue. Lower than normal RVOL demonstrates a lack of commitment, and can indicate an upcoming trend reversal or the start of a trading range.
In addition to warning of upcoming reversals, RVOL can help to determine whether a recent change in trend direction has staying power. A pullback with low RVOL is likely just a pullback, but if higher than usual volume accompanies that price drop, traders may be committed enough to keep the new downward trend going.
RVOL Thresholds
An RVOL value of 1.0 indicates that the current value is exactly the same as the average volume; anything above 1.0 is “above average” and anything below 1.0 is “below average.” In practice though, an RVOL of 1.1 may not be worth acting on.
The threshold for “significantly” above average volume will be different for each investor. Many day traders look for an RVOL over 2.0 before investing.
It's also important to be wary of extreme values for RVOL. If the RVOL suddenly spikes to 4.0 or more, especially while the security is overbought/oversold, that could foreshadow a trend reversal - the exact opposite result of a more moderately above average RVOL.
Conclusion
Relative Volume (RVOL) compares current volume levels to average volume levels over a specified look-back period, in order to identify significant trader commitment to a price move. Above average RVOL is generally associated with continuation of the trend, while below average RVOL may indicate a trend reversal or an emerging trading range.
Remember that just like volume, Relative Volume (RVOL) is used to confirm a price trend. This indicator is intended to be used in conjunction with other indicators and analysis techniques, not on its own, in order to make solid investment decisions.
Charting with RVOL
Relative Volume can be charted on StockChartsACP after installing our free Relative Volume Indicator Pack. Please see our StockChartsACP Plug-Ins article in the Support Center for more information on installing this plug-in.
Once the plug-in is installed, three different Relative Volume indicators can be added from the Chart Settings panel for your StockChartsACP chart: the classic Relative Volume (RVOL) indicator, the Relative Volume - Price Plot (RVOL-PP) overlay, and the Relative Volume - Time of Day (RVOL-TOD) indicator.
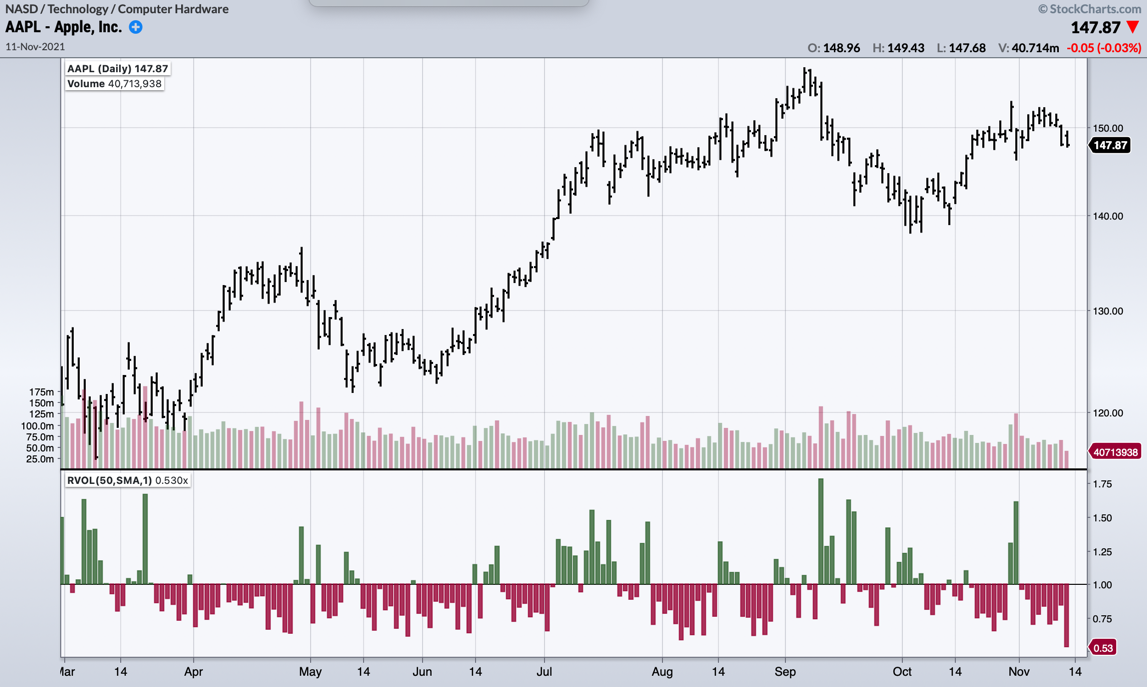
Relative Volume (RVOL)
The classic RVOL indicator can be positioned above, below or behind the security's price plot.
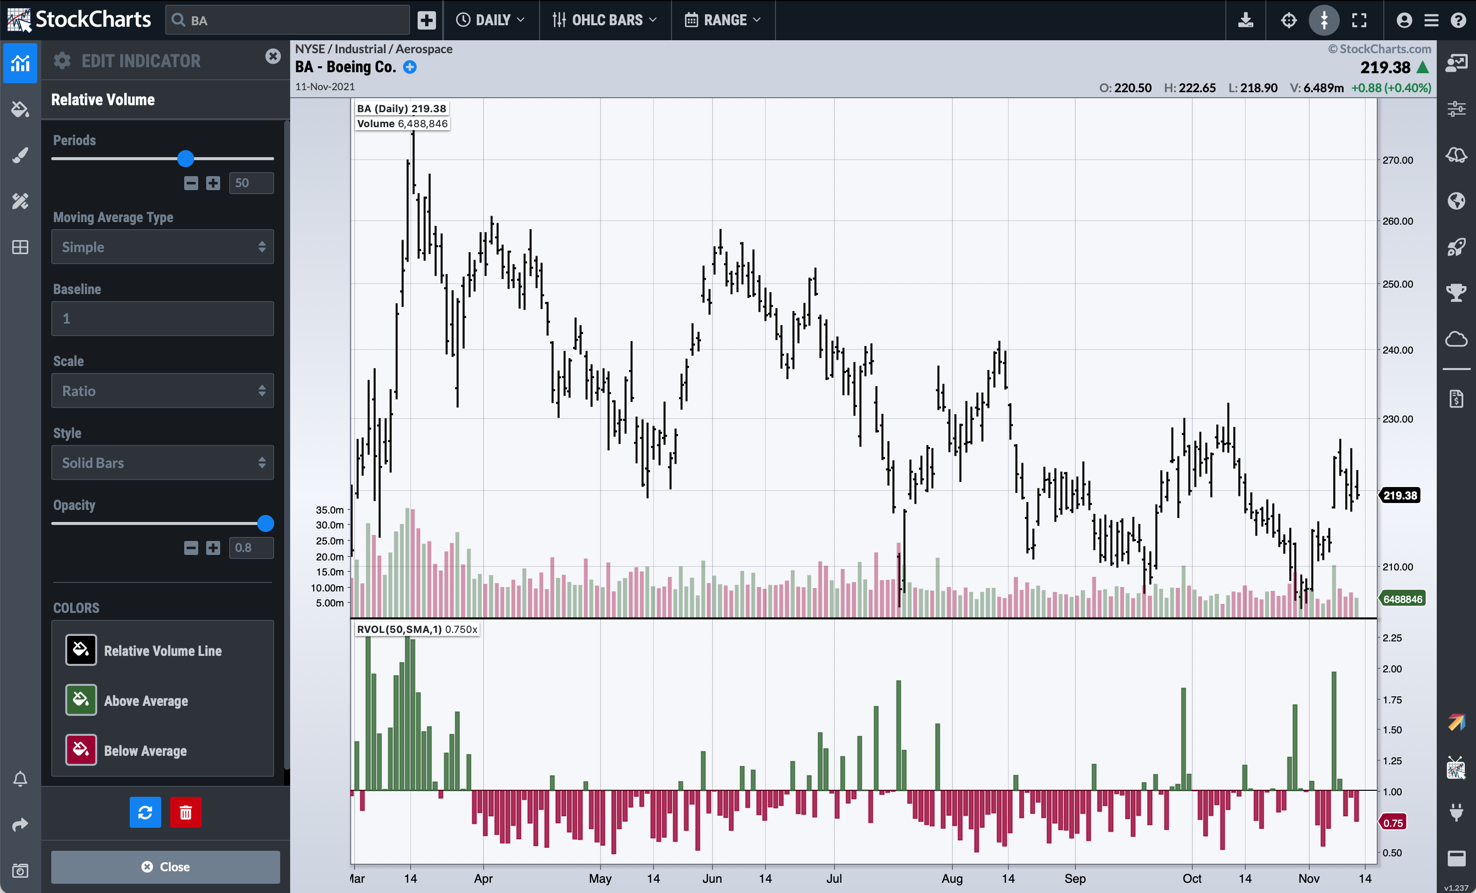
By default, the indicator is calculated using a 50-period SMA, but the number of periods and the moving average type can be adjusted to meet your technical analysis needs.
The Baseline is set at 1.0 (where current volume is the same as the average volume) by default, but this threshold can be changed by modifying the Baseline value in the indicator settings. Values above the user-specified Baseline will typically be displayed in green; values below will typically be displayed in red (these colors can be changed in the indicator settings). The default histogram can also be changed to a line chart or other style of chart in the indicator settings.
The Scale is set to Ratio by default, as this is how RVOL is traditionally measured. Chartists can change the Scale to Percentage instead, and the values will be shown as the percentage that the current volume is above or below average. When Scale is set to Percentage, the Baseline setting is automatically changed to 0.0, the value where current volume is equal to average volume; use negative numbers to set the baseline at lower than average volume (e.g. -20 sets the baseline at 20% below average).
Relative Volume - Price Plot (RVOL-PP)
The RVOL-PP overlay marks RVOL ratio values above and below a user-specified threshold, directly on the main price plot. In the example below, that Baseline has been set to 1.3; green arrows on the price plot show price bars where RVOL is above 1.3, and red arrows show price bars where RVOL is below 1.3.
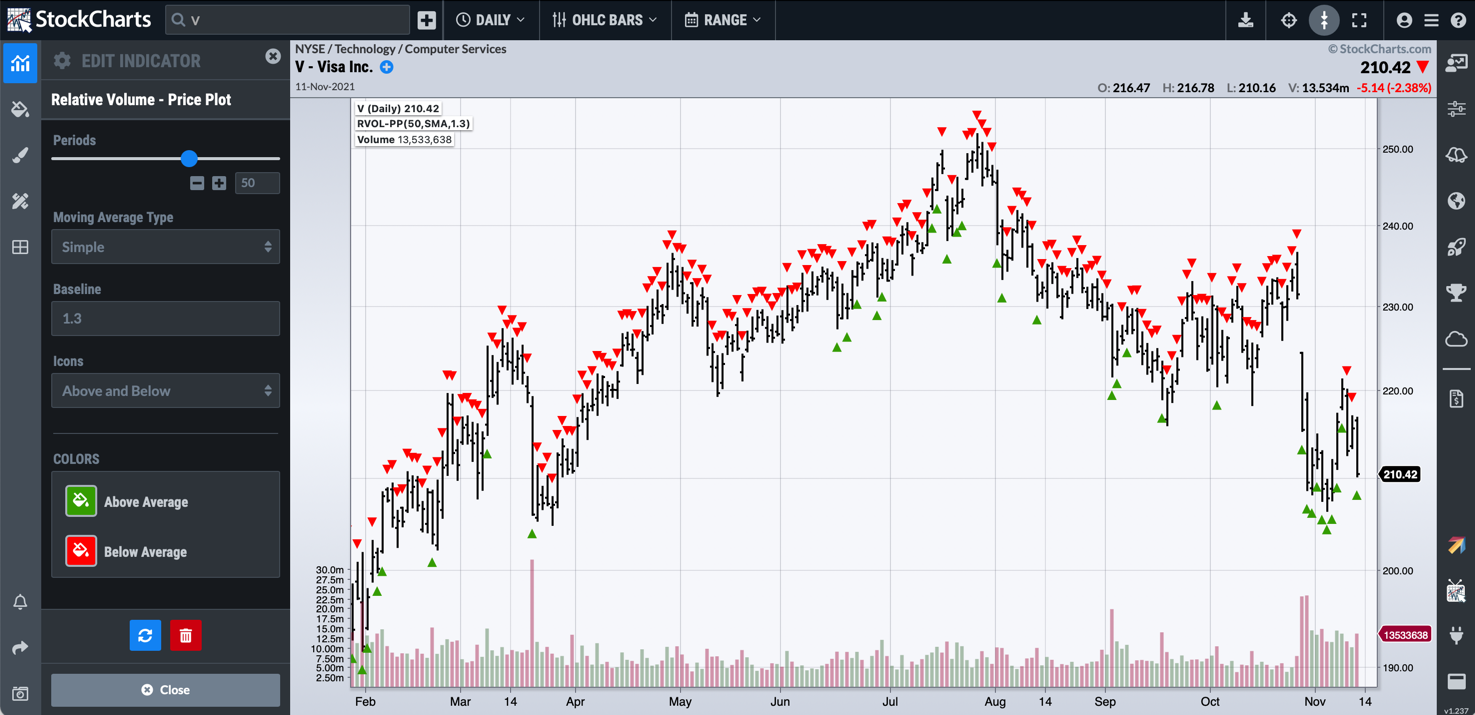
By default, the overlay is calculated using a 50-period SMA, but the number of periods and the moving average type can be adjusted to meet your technical analysis needs.
The Baseline is set at 1.0 (where current RVOL is the same as the average RVOL) by default, but this threshold can be changed by modifying the Baseline value in the overlay settings. Price bars with RVOL values above the user-specified Baseline will be marked with green arrow icons on the price plot; price bars with RVOL values below the Baseline will be marked with red arrow icons. Users can choose to display arrow icons for values above the Baseline, below the Baseline, or both.
Relative Volume - Time of Day (RVOL-TOD)
While the classic RVOL indicator aggregates volume across the entire trading day, RVOL-TOD lets you compare volume to the average at a specific time of day. This is useful for short-term traders, as volume can be much higher at the beginning or end of the trading day than at other times of day.
The RVOL-TOD indicator uses the same formula as classic RVOL, but calculates the value using only specific bars on an intraday chart. For example, on a 5-minute chart, the RVOL-TOD value for today's 9:30 bar would compare volume for that bar with the average volume on previous 9:30 AM 5-minute bars.
The chart below shows the average volume for each bar as a line chart, overlaid on the actual volume bars. It is easy to see at a glance which bars have higher or lower volume than average.
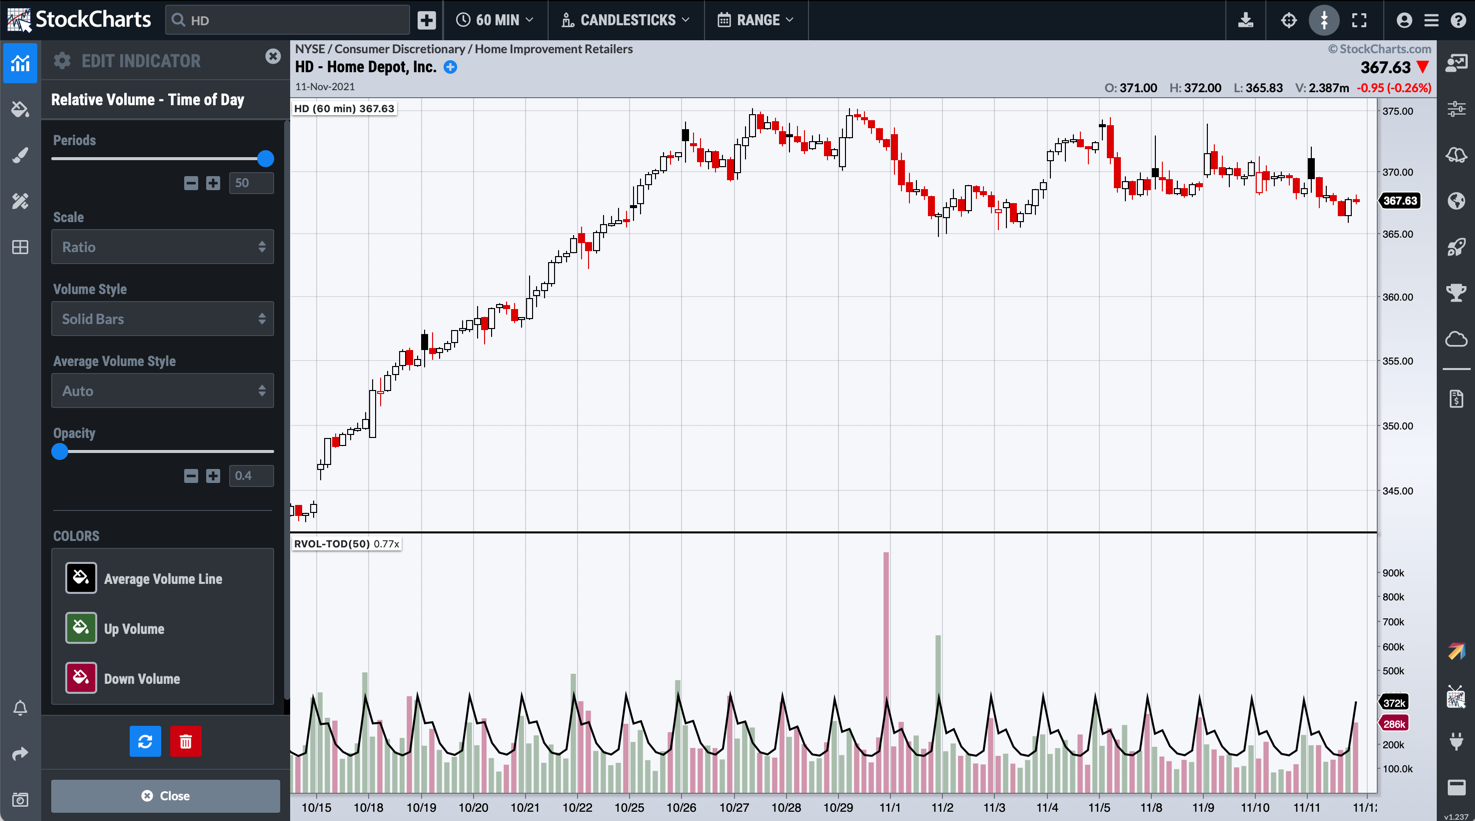
By default, the indicator is calculated using a 50-period SMA, but the number of periods can be adjusted to meet your technical analysis needs. Note that the moving average type cannot be modified.
The RVOL-TOD ratio value for the current bar is shown in the legend for the indicator panel. Change the Scale setting to Percentage to show the RVOL value in the legend as a percentage instead of a ratio.
Scanning for RVOL
StockCharts members can screen for stocks based on Relative Volume (RVOL) values. Below are some example scans that can be used for RVOL-based signals. Simply copy the scan text and paste it into the Scan Criteria box in the Advanced Scan Workbench.
Members can also set up alerts to notify them when a RVOL-based signal is triggered for a stock. Alerts use the same syntax as scans, so the sample scans below can be used as a starting point for setting up alerts as well. Simply copy the scan text and paste it into the Alert Criteria box in the Technical Alert Workbench.
Above Average RVOL in an Uptrend
This scan reveals stocks where the RVOL value is above average during an uptrend. First, stocks must be above their 200-day moving average to be in an overall uptrend. Second, RVOL must be between 2.0 and 3.0 to show above-average (but not too far above average) volume. This scan is just a starting point. Further refinement and analysis are required.
[type = stock] AND [country = US]
AND [Daily SMA(20,Daily Volume) > 40000]
AND [Daily SMA(60,Daily Close) > 20]

AND [Daily Close > Daily SMA(200,Daily Close)]
AND [RVOL SMA(50) >= 2.0]
AND [RVOL SMA(50) <= 3.0]
Above Average RVOL in a Downtrend
This scan reveals stocks where the RVOL value is above average during a downtrend. First, stocks must be below their 200-day moving average to be in an overall downtrend. Second, RVOL must be between 2.0 and 3.0 to show above-average (but not too far above average) volume. The EMA version of RVOL is used to assess volume over a shorter-term timeframe. This scan is just a starting point. Further refinement and analysis are required.
[type = stock] AND [country = US]
AND [Daily SMA(20,Daily Volume) > 40000]
AND [Daily SMA(60,Daily Close) > 20]

AND [Daily Close < Daily SMA(200,Daily Close)]
AND [RVOL EMA(20) >= 2.0]
AND [RVOL EMA(20) <= 3.0]
For more details on the syntax to use for RVOL scans, please see our Scan Syntax Reference in the Support Center.