
|
Table of Contents
Trading the Death Cross
It sounds a bit menacing, and perhaps that’s the point. It’s called the Death Cross, and traders have collectively referred to this particular moving average crossover as an endpoint for an uptrend or bullish conditions.
What is a Death Cross?
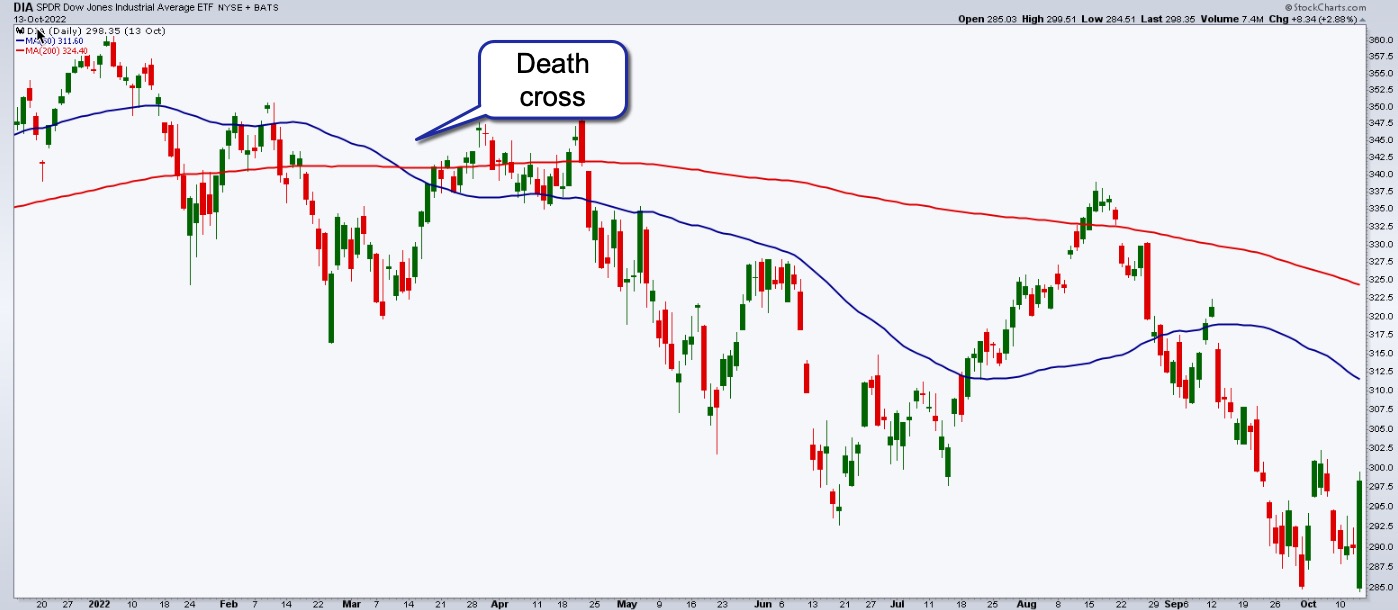
The Death Cross is a bearish chart pattern that forms when a short-term moving average, typically the 50-day simple moving average (SMA), crosses below a long-term moving average, most commonly a 200-day SMA.
The Death Cross is a bearish signal as it indicates that an asset’s price may likely undergo further declines. It also indicates the possibility that an uptrend may have met its endpoint—a reversal toward an emerging downtrend or toward an indecisive (sideways) trading range.
Taking a Broader View of the Moving Average Crossovers
To better understand the Death Cross in relation to its bullish twin, the Golden Cross, let’s view both in context using the more commonly adopted 50-day SMA and 200-day SMA.
Note: The keyword here is “conditions.”
- When the 50-day SMA is above the 200-day SMA, it generally indicates bullish conditions.
- When the 50-day SMA is below the 200-day SMA, it generally indicates bearish conditions.
While an asset is always in one of those two states, neither state can tell us that price is definitively in an uptrend or downtrend. Instead, it tells us that the general conditions based on these two moving averages are currently (or may still be) bullish or bearish.
Bullish or bearish contexts can change, and that’s why it’s important to view the market from different angles to get a more accurate reading.
What Happens After a Death Cross?
A bearish pattern or event, a Death Cross can indicate several potentialities whose outcomes may vary.
- An uptrend may have reached a relative or a more significant peak.
- Prices have declined with enough consistency or momentum to have brought the faster moving average below the slower moving average.
- Selling activity has intensified enough to cause either a sudden drop in prices or a steady decline over a period of time.
- Market sentiment may be increasingly bearish, as evidenced by falling prices.
How Can You Trade With the Death Cross
Generally, traders and investors alike use the Death Cross to identify or confirm a bearish reversal in the market.
Death Cross as a Confirmation Signal. Traders seeking a broader view of trend conditions might look to the crossover event as a significant indicator that the market environment may be turning bearish.
Death Cross as a Signal to Reduce Exposure. Longer term investors who actively rebalance their portfolios commonly use the crossover as a signal to potentially reduce their exposure to assets exhibiting this pattern.
Death Cross as a Short Entry Signal. Traders looking to go short may use the Death Cross as a precondition for a “short” strategy.
Death Cross as a Stop-Loss Level. Traders who are short a given market may look to the Death Cross price point or range to help determine appropriate stop-loss levels.
What To Watch Out For When Using a Death Cross
Not All Crossovers Are the Same
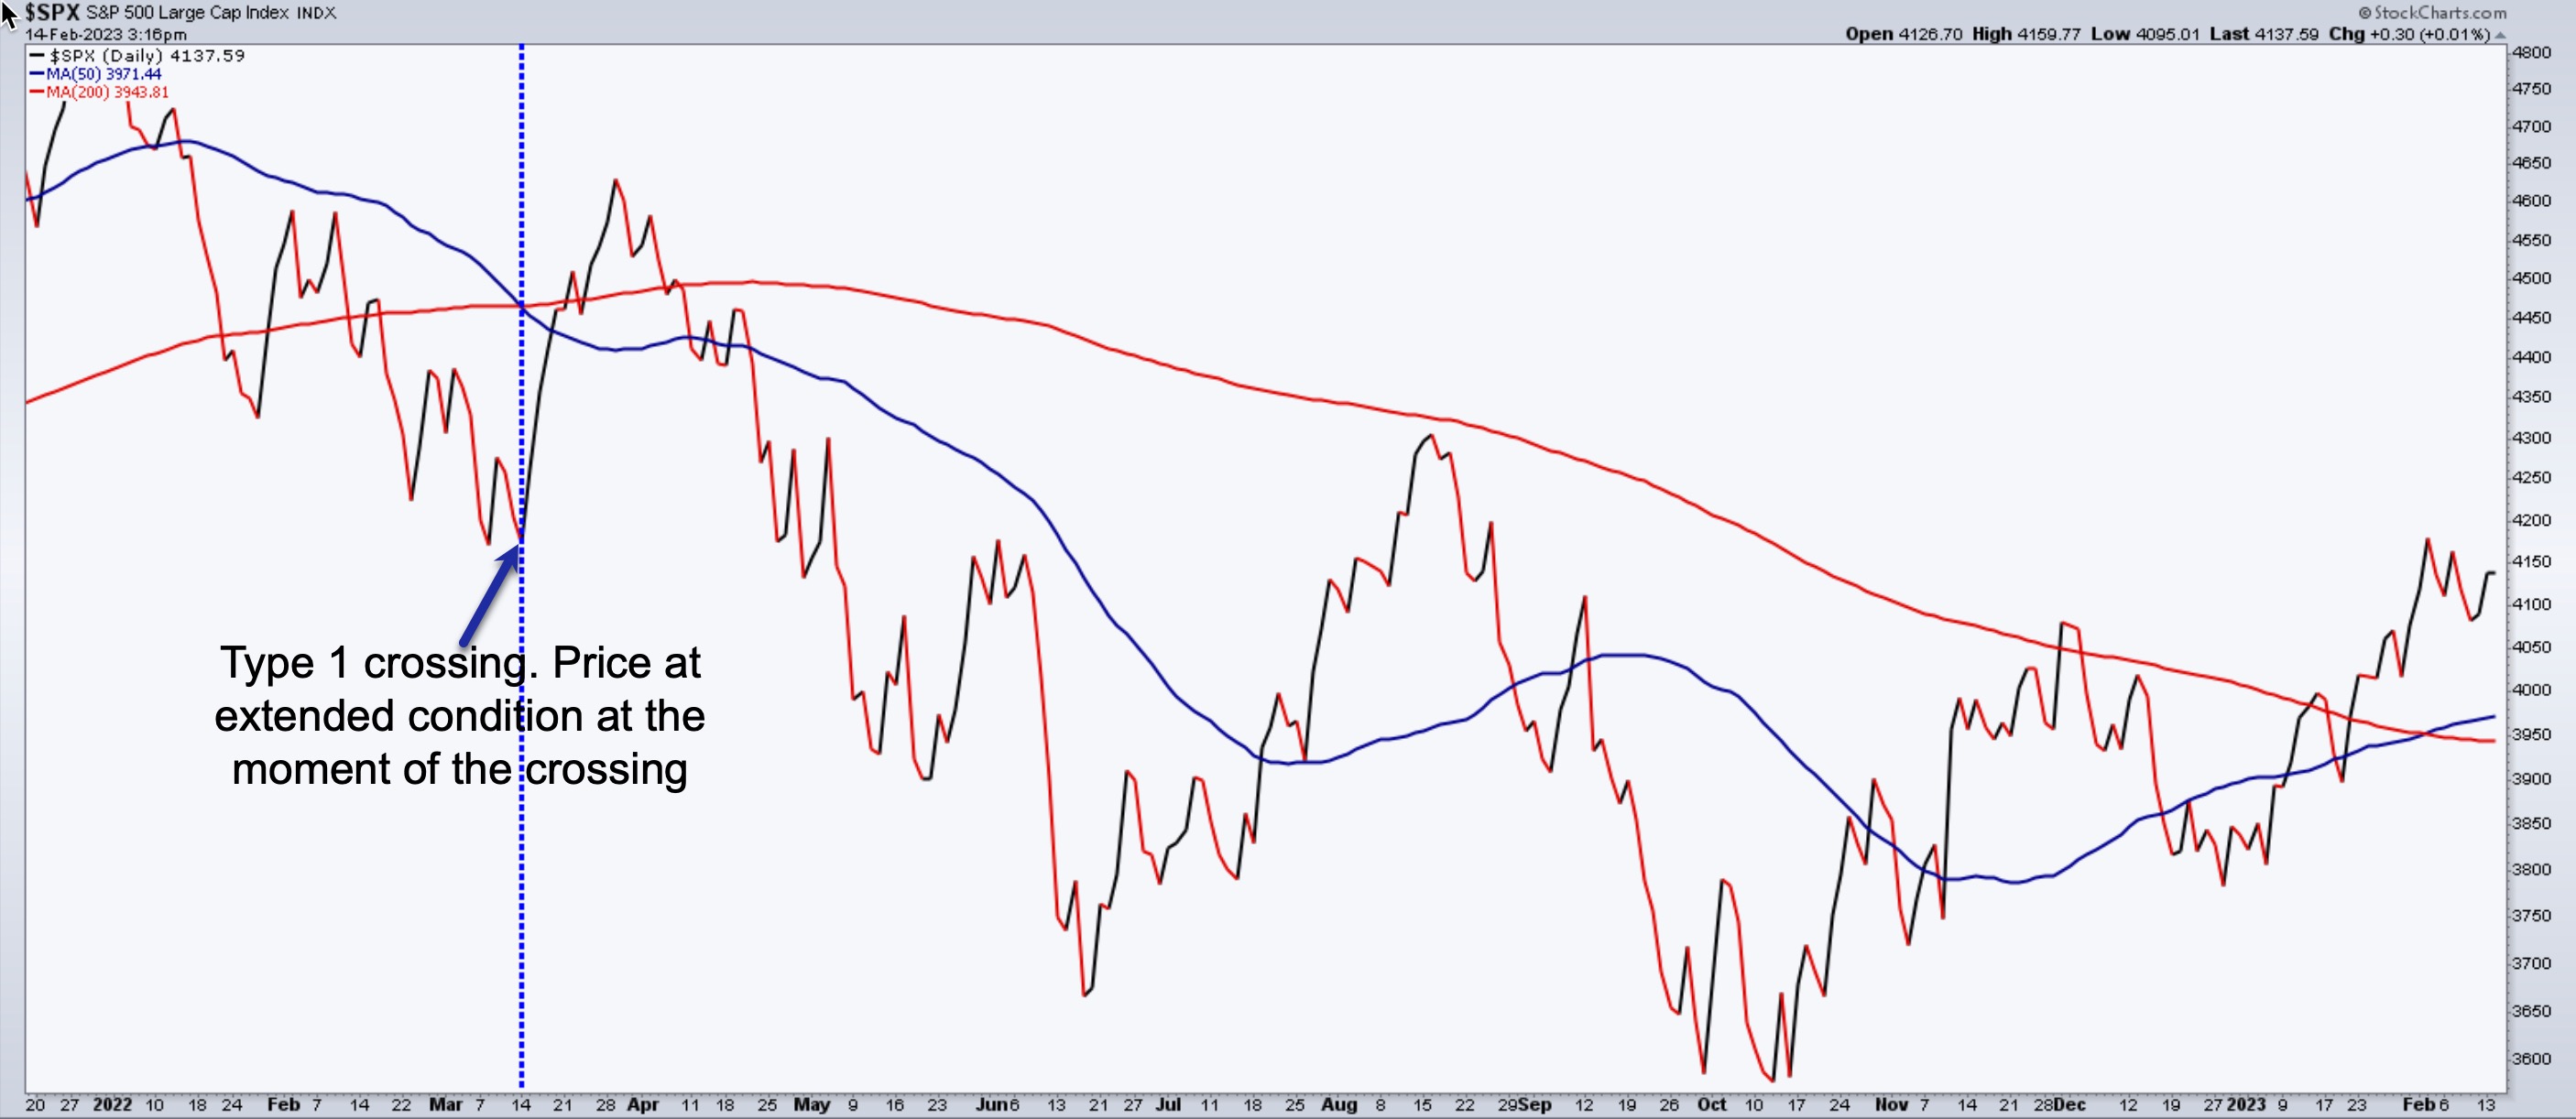
Technical analyst Tom McClellan makes a distinction between two types of crossovers:
- Type 1 Crossing, where prices are extended far from the actual crossover price point (and in the direction of the crossover); and
- Type 2 Crossing, where prices retrace the actual price point in which the crossover event took place.
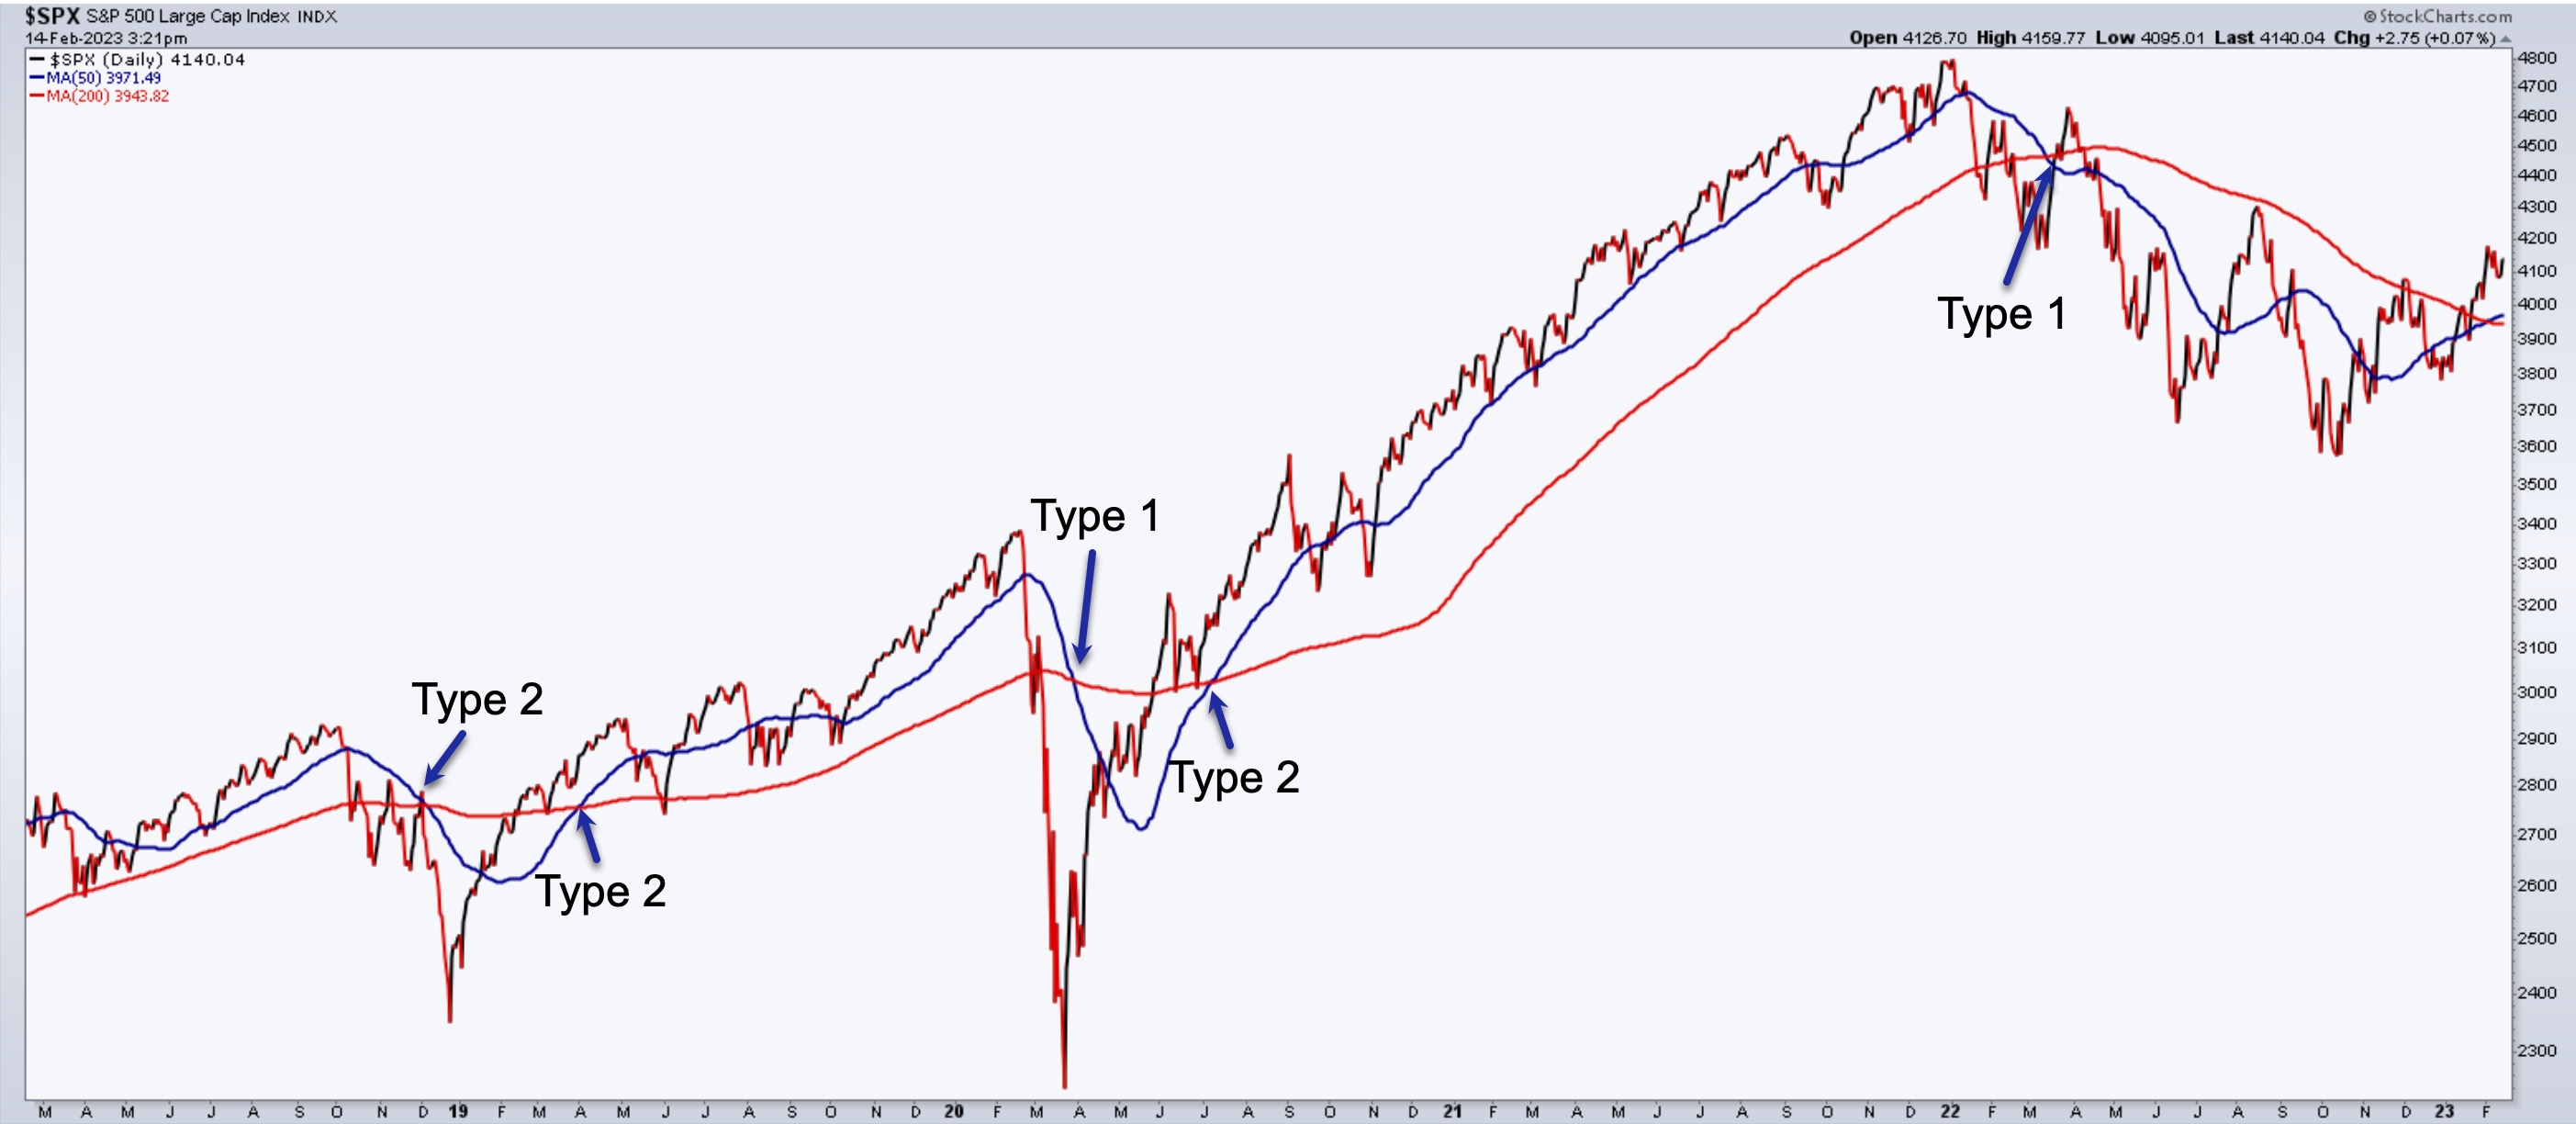
McClellan advances the notion that type 1 crossover events can mark a temporary or more significant reversal (shown below).
In contrast, a type 2 event may often indicate a resumption of the trend prior to the crossover (the Golden Cross example below shares the same principle as the Death Cross but in reverse).
Price Action and Market Conditions Following a Death Cross Event What happens after a Death Cross matters. If the price action shows indications of bullishness (meaning, prices are rising or spiking upward), it indicates a possibility that the bearish indication may or may not follow through. Furthermore, declines on low volume may indicate a lack of conviction on the part of sellers or market bears.
Death Cross and Golden Cross events occasionally fail to follow through. It’s important to garner as much market and economic insight to better contextualize the price action that may be occurring, notably when the market betrays a sense of indecision following either of these major signals.
Conclusion
Popular wisdom has it that the Death Cross is virtually a “death knell” to a given asset’s bullish conditions. While this may generally be true, at least on a superficial level, much more nuance goes into the interpretation of such an event. Be sure to view Death Crosses from a wider angle of interpretation. The pattern can “indicate” a potential condition, but it’s the trader’s job to fine-tune such insights into a more accurate read on the market.