|
|
Table of Contents
Faber's Sector Rotation Trading Strategy
Sector Rotation-based trading strategies are popular because they can improve risk-adjusted returns and automate the investing process. Momentum investing, which is at the heart of the sector rotation strategy, seeks to invest in sectors showing the strongest performance over a specific timeframe. Momentum investing is another form of relative strength investing. This article will explain the strategy and show investors how to implement it using the tools at StockCharts.com.
Faber and O'Shaunessey
There are many papers supporting the concept of momentum investing and relative strength investing. In his book, What Works on Wall Street, James O'Shaunessey details the best performing strategies over the last fifty years. Now in its fourth edition, O'Shaunessey found that relative strength strategies were consistently at the top of the performance list. Investors are rewarded for buying the strongest stocks and avoiding the weakest. The strong tend to get stronger, while the weak tend to get weaker. This makes sense because Wall Street loves its winners and hates its losers.
Mebane Faber, of Cambria Investment Management, wrote a white paper entitled Relative Strength Strategies for Investing. Using sector/industry group data going back to the 1920s, Faber found that a simple momentum strategy outperformed buy-and-hold approximately 70% of the time. In other words, buying the sector/industry groups with the largest gains outperformed buy-and-hold over a test period that exceeded 80 years. This strategy worked for 1-month, 3-month, 6-month, 9-month and 12-month performance intervals. Furthermore, Faber also found that performance could be improved by adding a simple trend-following requirement before considering positions.
Strategy Details
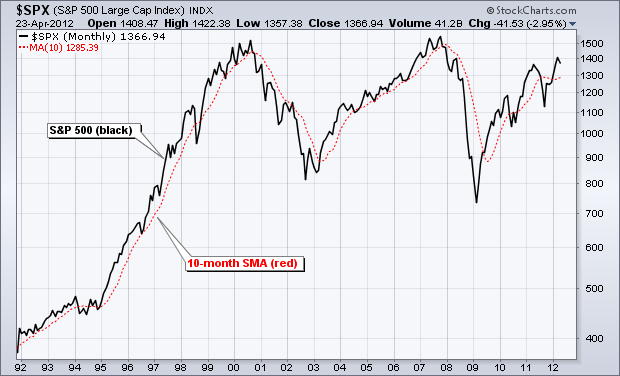
The strategy described here is based on the findings in Faber's white paper. First, the strategy is based on monthly data and the portfolio is rebalanced once per month. Chartists can use the last day of the month, the first day of the month or a set date every month. The strategy is long when the S&P 500 is above its 10-month simple moving average and out of the market when the S&P 500 is below its 10-month SMA. This basic timing technique ensures that investors are out of the market during extended downtrends and in the market during extended uptrends. Such a strategy would have avoided the 2001-2002 bear market and the gut-wrenching decline in 2008.
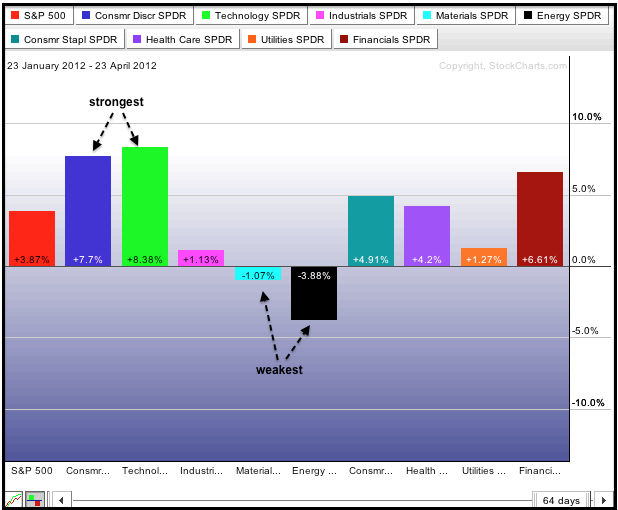
In his backtest, Faber used the 10 sector/industry groups from the French-Fama CRSP Data Library. These include Consumer Non-Durables, Consumer Durables, Manufacturing, Energy, Technology, Telecommunications, Shops, Health, Utilities and Other. “Other” includes Mines, Construction, Transportation, Hotels, Business Services, Entertainment, and Finance. Instead of searching for individual ETFs to match these groups, this strategy will simply use the nine sector SPDRs.
The next step is to choose the performance interval. Chartists can choose anything from one to twelve months. One month may be a little short and cause excessive rebalancing. Twelve months may be a bit long and miss too much of the move. As a compromise, this example will use three months and define performance with the three-month Rate-of-Change, which is the percentage gain over a three-month period.
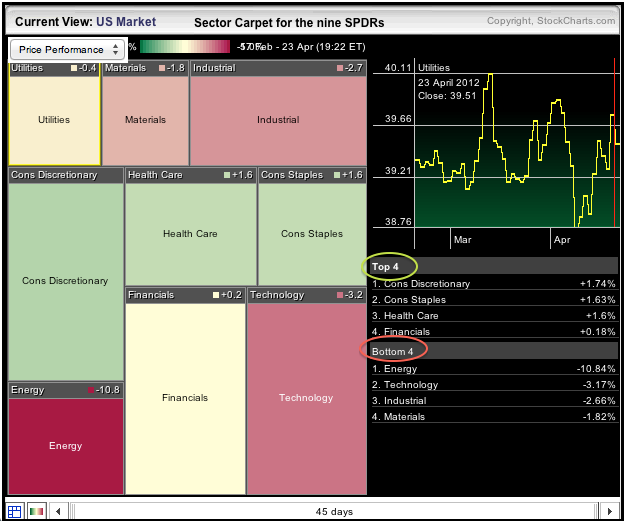
Chartists must then decide how much capital to allocate to each sector and to the strategy as a whole. Chartists could buy the top three sectors and allocate equal amounts to all three (33%). Alternatively, investors could implement a weighted strategy by investing the most in the top sector and lower amounts in the subsequent sectors.
Buy Signal: When the S&P 500 is above its 10-month simple moving average, buy the sectors with the biggest gains over a three-month timeframe.
Sell Signal: Exit all positions when the S&P 500 moves below its 10-month simple moving average on a monthly closing basis.
Rebalance: Once per month, sell sectors that fall out of the top tier (three) and buy the sectors that move into the top tier (three).
StockCharts Sector Summary
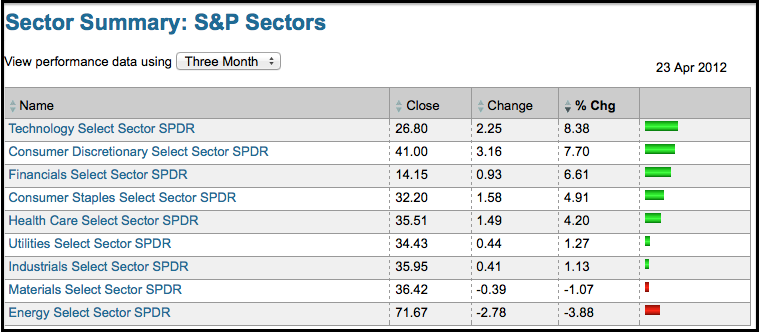
The Sector Summary at StockCharts.com can be used to implement this strategy on a monthly basis. The nine sector SPDRs are shown on one convenient page with an option to sort by percentage change. First, select the desired performance timeframe by using the dropdown menu just above the table. This example uses three-month performance. Second, click the “% Chg” heading to sort by percentage change. This will place the best performing sectors at the top.
Tweaking
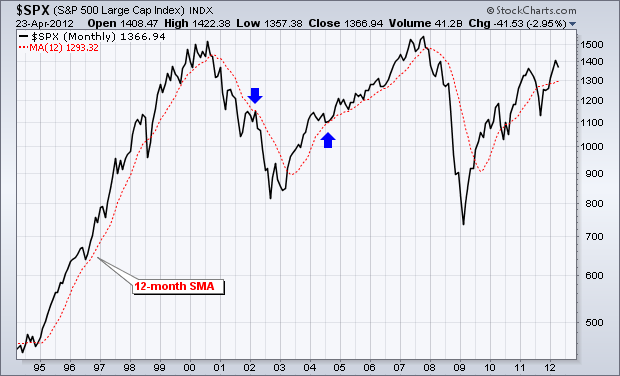
At the risk of curve-fitting, it seems that a 12-month simple moving average holds a strong trend better than a 10-month SMA. On the chart below, the blue arrows show where the S&P 500 broke the 10-month SMA, but held the 12-month SMA. The difference between the two moving averages is quite small and these differences are likely to even out over time. A 12-month moving average, however, does represent the one year average, which is an appealing timeframe from a long-term standpoint. Price has an upward bias when above this one-year moving average and a downward bias when below.
Conclusion
This sector rotation strategy is built on the premise that certain sectors will outperform and investing in these sectors will outperform the market overall. Even though an 80+ year backtest confirms this assumption, past performance is no guarantee of future performance. As with any strategy, self-discipline and adherence to the strategy are paramount. There will be bad months, perhaps even bad years. However, long-term evidence suggests that the good times will outweigh the bad times. This strategy can also be used as a first cut for stock selection. Traders can focus their efforts on stocks in the top three sectors and avoid stocks in the bottom six. Keep in mind that this article is designed as a starting point for trading strategy development. Use these ideas to augment your analysis process and risk-reward preferences.

