
|
Table of Contents
Chandelier Exit
Introduction
Developed by Charles Le Beau and featured in Alexander Elder's books, the Chandelier Exit sets a trailing stop-loss based on the Average True Range (ATR). The indicator is designed to keep traders in a trend and prevent an early exit as long as the trend extends. Typically, the Chandelier Exit will be above prices during a downtrend and below prices during an uptrend.
Chandelier Exit Calculation
The Chandelier Exit formula consists of three parts: a period high or period low, the Average True Range (ATR) and a multiplier. Using the default setting of 22-periods on a daily chart, the Chandelier Exit will look for the highest high or lowest low of the last 22 days. Note that there are 22 trading days in a month. This parameter (22) will also be used to calculate the Average True Range.
Chandelier Exit (long) = 22-day High - ATR(22) x 3
Chandelier Exit (short) = 22-day Low + ATR(22) x 3
As shown in the formulas above, there is a Chandelier Exit for long positions and one for short positions. The long position exit hangs three ATR values below the 22-period high. This means it rises and falls as the period high and the ATR value changes. By contrast, the short position exit is placed three ATR values above the 22-period low. The spreadsheet examples show sample calculations for both.

Learn More: Average True Range (ATR)
Interpreting Chandelier Exits
The Chandelier Exit is basically a volatility-based system that identifies outsized price movements. Le Beau defined volatility by using the Average True Range, which was developed by Welles Wilder, creator of RSI and the Average Directional Index. ATR uses the prior close, current high and current low to determine the “True Range” for a given period. After some smoothing, the daily True Range values evolve into the Average True Range for a given period of time.


By setting the Chandelier Exit for longs three ATR values BELOW the period high, the indicator provides a buffer that is three times the volatility. A decline strong enough to break this level warrants a reevaluation of long positions. The opposite applies to short positions. The Chandelier Exit for shorts is set three ATR values ABOVE the period low, which provides a volatility-based buffer. An advance strong enough to exceed this level warrants a reevaluation of short positions.
Chandelier Uptrend
Sometimes chartists will see a strong uptrend, but not know where to jump on and when to exit. The Chandelier Exit can be used to define the trend and set a trailing stop-loss. The example below shows Eaton Corp (ETN) breaking out in early November and starting an extended uptrend. The Chandelier Exit defined this uptrend quite well as it followed price action steadily higher. This trailing stop-loss could have been used to control risk for new long positions.

With the Chandelier Exit providing the stop-loss, traders would then need to find an indicator to trigger buy signals within this trend. A sensitive momentum oscillator can be used to capture short-term oversold conditions. The indicator window shows StochRSI, which is the Stochastic Oscillator applied to RSI. Dips below .20 reflect short-term oversold conditions. A subsequent move back above .20 suggests that the uptrend is continuing.
Chandelier Downtrend
Some stocks are more volatile than others and require a bigger buffer, which means the multiplier should be increased. The Hewlett-Packard (HPQ) example shows the stock in a clear downtrend for most of 2012. A normal Chandelier Exit (22,3.0,short) would have triggered some stops just before the downtrend continued. Notice how HPQ moved above the dashed gray line several times during this downtrend. Chartists should increase the ATR multiplier for more volatile stocks, such as techs. In this example, the red Chandelier line allows for more volatility by using 5 as the multiplier. HPQ held this Chandelier setting until the breakout in mid-December, which signaled the start of an uptrend.

The Chandelier Exit is good for stops, but chartists need to use basic chart analysis or a momentum oscillator to time entries. The Commodity Channel Index (CCI) can be used to identify short-term overbought conditions within a downtrend. CCI becomes overbought with a move above +100. A subsequent move back below +100 signals that momentum is turning down again.
Conclusion
The Chandelier Exit is mostly used to set a trailing stop-loss during a trend. Trends sometimes extend further than we anticipate and the Chandelier Exit can help traders ride the trend a little longer. Even though it is mostly used for stop-losses, the Chandelier Exit can also be used as a trend tool. A break above the Chandelier Exit (long) signals strength, while a break below the Chandelier Exit (short) signals weakness. Once a new trend begins, chartists can then use the corresponding Chandelier Exit to help define this trend.
Charting with Chandelier Exits
The Chandelier Exit overlay can be added to SharpCharts and ACP charts.
Using with SharpCharts
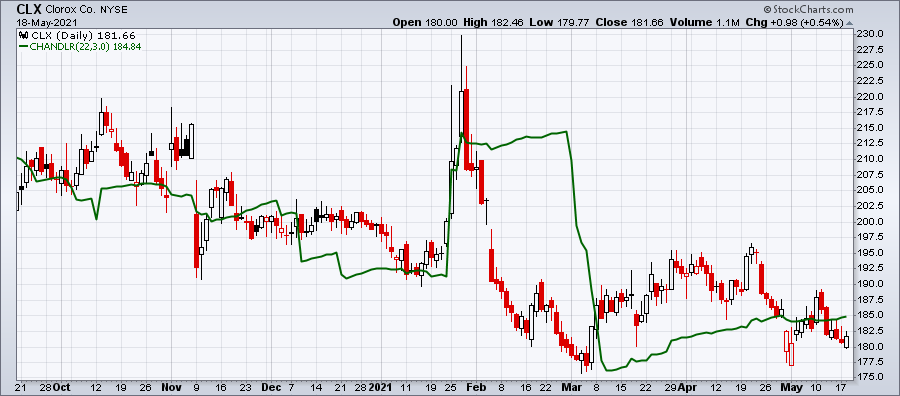
Click here for a live version of this chart.
The Chandelier Exits are available on SharpCharts in the “Overlays” section. Once chosen, the default settings will appear in the parameters box (22,3.0). This default setting is designed for long positions. The number 22 sets the periods for the Average True Range (ATR) and the date range for the period high or low. The number 3.0 sets the ATR multiplier. Volatile stocks may require a higher multiplier to reduce whipsaws. Relatively dull stocks may need a lower multiplier to increase sensitivity. Chartists can modify the Chandelier Exit for short positions by simply adding a comma and the word short (22,3.0,short).

For more details on the parameters used to configure Chandelier Exit overlays, please see our SharpCharts Parameter Reference in the Support Center.
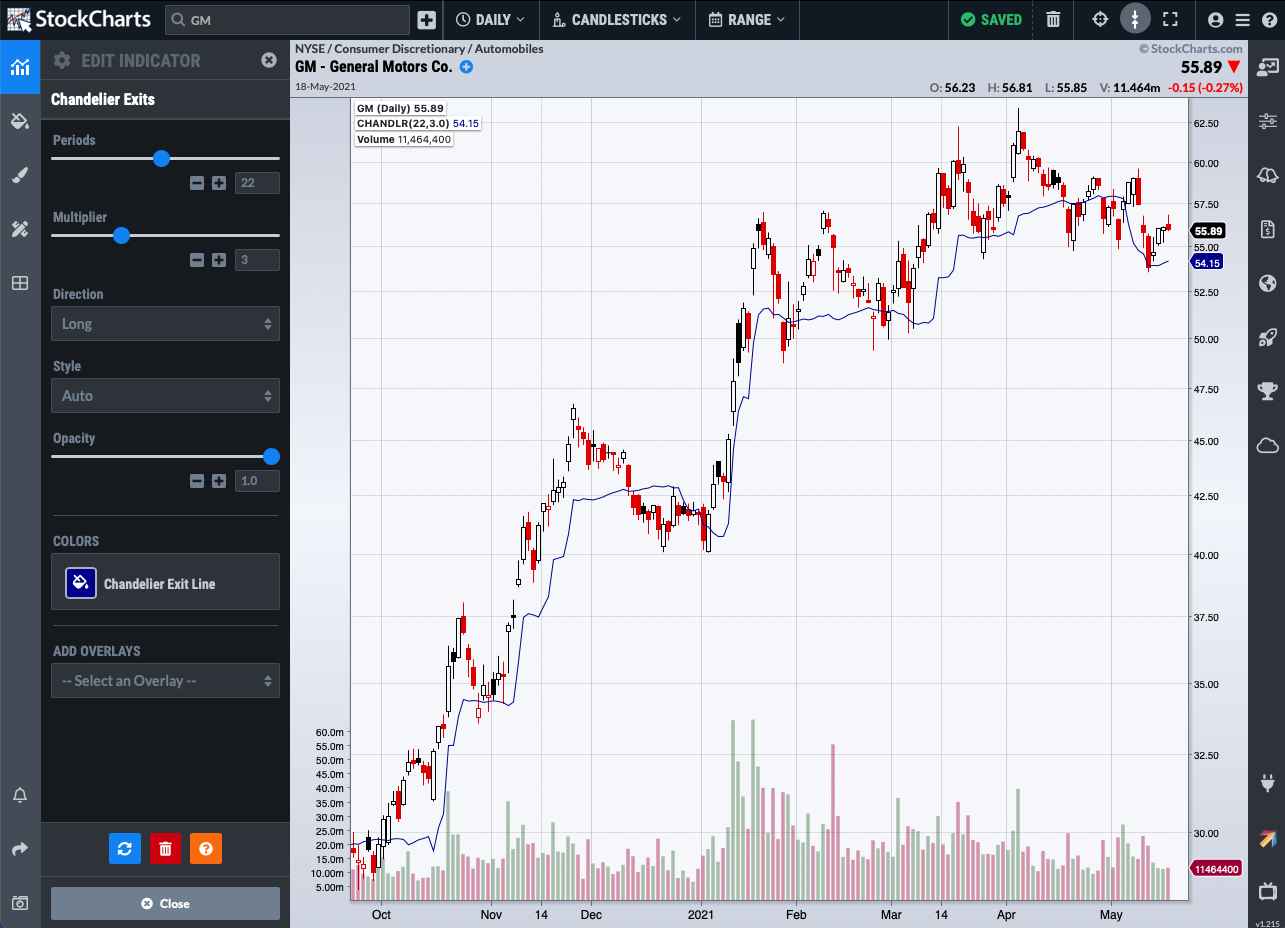
Using with StockChartsACP
This overlay can be added from the Chart Settings panel for your StockChartsACP chart. Chandelier Exits can be overlaid on the security's price plot or on an indicator panel.
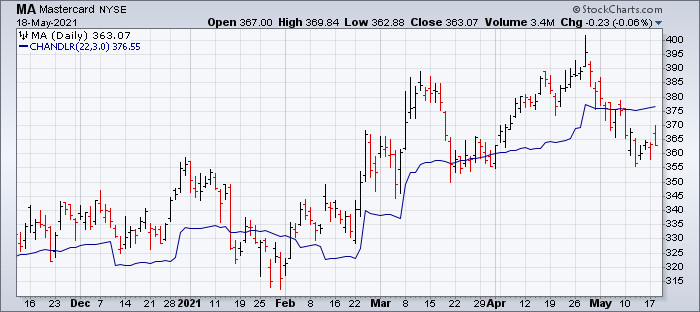
Click here for a live version of this chart.
By default, the overlay uses 22 periods and an ATR multiplier of 3.0. These parameters can be adjusted to meet your technical analysis needs. In addition, chartists can specify whether the indicator is calculated based on exiting a short or a long position.
Scanning for Chandelier Exits
StockCharts members can screen for stocks based on Chandelier Exit values. Below are some example scans that can be used for Chandelier Exit-based signals. Simply copy the scan text and paste it into the Scan Criteria box in the Advanced Scan Workbench.
Members can also set up alerts to notify them when a Chandelier Exit-based signal is triggered for a stock. Alerts use the same syntax as scans, so the sample scans below can be used as a starting point for setting up alerts as well. Simply copy the scan text and paste it into the Alert Criteria box in the Technical Alert Workbench.
Price Crosses above Chandelier Exit
This simple scan searches for stocks where the price has crossed above the Chandelier Exit (long) and daily volume was above the 50-day moving average of volume. In other words, the bullish crossover occurred with expanding volume.
[type = stock] AND [country = US]
AND [Daily SMA(20,Daily Volume) > 100000]
AND [Daily SMA(60,Daily Close) > 20]

AND [Daily Close crosses Chandlr(22,3.0,long)]
AND [Daily Volume > Daily SMA(50,Daily Volume)]
Price Crosses below Chandelier Exit
This simple scan searches for stocks where the price has crossed below the Chandelier Exit (short) and daily volume was above the 50-day moving average of volume. In other words, the bearish crossover occurred with expanding volume.
[type = stock] AND [country = US]
AND [Daily SMA(20,Daily Volume) > 100000]
AND [Daily SMA(60,Daily Close) > 20]

AND [Chandlr(22,3.0,short) crosses Daily Close]
AND [Daily Volume > Daily SMA(50,Daily Volume)]
For more details on the syntax to use for Chandelier Exit scans, please see our Scanning Indicator Reference in the Support Center.