|
|
Table of Contents
How To Trade Price-to-Moving Average Crossovers
KEY TAKEAWAYS
- A price-to-moving average crossover identifies entry and exit points by focusing on price movement at the time price intersects with a moving average
- The moving average periods you use depends on how long you intend to hold the position
- You can trade bullish or bearish moving average crossovers depending on stock market conditions
Say you use a moving average—such as the 50-day simple moving average (SMA)—to measure the direction of a trend. If prices are above the 50-day SMA and both are rising, you can assume that a stock is in an uptrend. If prices are below the 50-day SMA and both fall, it’s likely a downtrend. When both are flat and price moves above and below a flat SMA, the market is probably going sideways, meaning there’s no trend.
These concepts are easy enough to grasp. But to exploit a trading opportunity early on, you might have to wait until prices and their corresponding moving average cross. In other words, you might wait for and take advantage of a bullish or bearish price and moving average crossover to make a more aggressive market entry. It can be a bit tricky, depending on the situation, but here are a few ways to do it.
Why Trade Price-to-Moving Average Crossovers?
Moving averages provide a window into a stock’s underlying trend. By comparing the price of an asset to its moving average, you get a better picture of a stock’s trajectory and can anticipate where prices may be heading next.
A price-to-moving average crossover is a technique that focuses on the moments when the asset price intersects with its moving average. These intersections or “crossovers” can signal a shift in trend, offering up some potential trade opportunities. First, let’s look at the two types of crossovers.
Types of Crossovers
There are generally two types of crossovers. Note that these are not “hard” rules but rules of thumb that depend on the larger context. So, keep them in mind, but stay flexible.
- Bullish Crossover. This is when the price moves above its moving average. It often suggests that the stock’s momentum is starting to move upward, indicating a potential buying opportunity.
- Bearish Crossover. When the stock's price falls below its moving average, it’s generally considered bearish. It tells you that the stock has lost bullish momentum and is either pulling back to take a breather or entering a downtrend. If the latter, it suggests a selling or short-selling opportunity.
Again, these are conditional and heavily reliant on the context. We’ll get into this later, but for now, it’s important to remember that longer-term moving averages may be a bit less vulnerable to “market noise,” which can result in giving you more false (bullish or bearish) signals. So, let's get to it. Here are a few basic rules to work into your trading plan.
Which Period Moving Averages Should I Use?
The choice of which moving average you might want to use boils down to the timeframe of your trading window.
- Short-term periods. The 5-day or 10-day SMA might be suitable.
- Intermediate-term periods. The 20-day or 50-day SMA might fit your trading window. For many traders, the 50-day SMA, in particular, serves as a critical support or resistance level.
- Long-term periods. The 100-day or 200-day SMA are typically your go-to averages.
The choice of MA period also depends on your approach or trading strategy. The best thing to do is to experiment with different settings to find the best MA period that matches your groove.
How To Trade a Bullish Price Crossover
Step 1. Confirm the Crossover Before making any move, ensure the price has conclusively crossed above the moving average. So, if you’re using candlestick charts, you’ll have to wait for a full candle close above the SMA.
Step 2. Check Supporting Context and Indicators Look for confluence with other technical indicators. For example, the relative strength index (RSI) might indicate the asset is not yet overbought, or the Stochastic Oscillator could be showing a bullish crossover of its own. If the SMA is rising, then it’s a bullish sign; but if the SMA is falling, you should have a good reason to take a bullishly contrarian position.
Step 3. Check the Trading Volume A significant increase in volume shows bullish trend strength. If not, then tread carefully, as your chances of acting on a false signal are much greater (and this depends on the overall market context and other indicator readings).
Step 4. Determine Your Entry Point Enter a long position after confirming the crossover and other signals. The exact entry point might vary based on personal strategy. Some traders prefer entering immediately upon confirmation, while others might wait for a breakout above the crossover candle or a retest of the moving average as support.
Step 5. Set Your Stop-Loss Place your stop-loss slightly below the SMA or the most recent swing low. This step ensures limited loss in case the crossover was a false signal.
Step 6. Determine Your Profit Target Set a take-profit based on a resistance level, a measured move, a trailing stop, or any strategically-determined target approach. You want to catch as much upside as possible while minimizing your downside risk.
Example of Trading a Moving Average Crossover

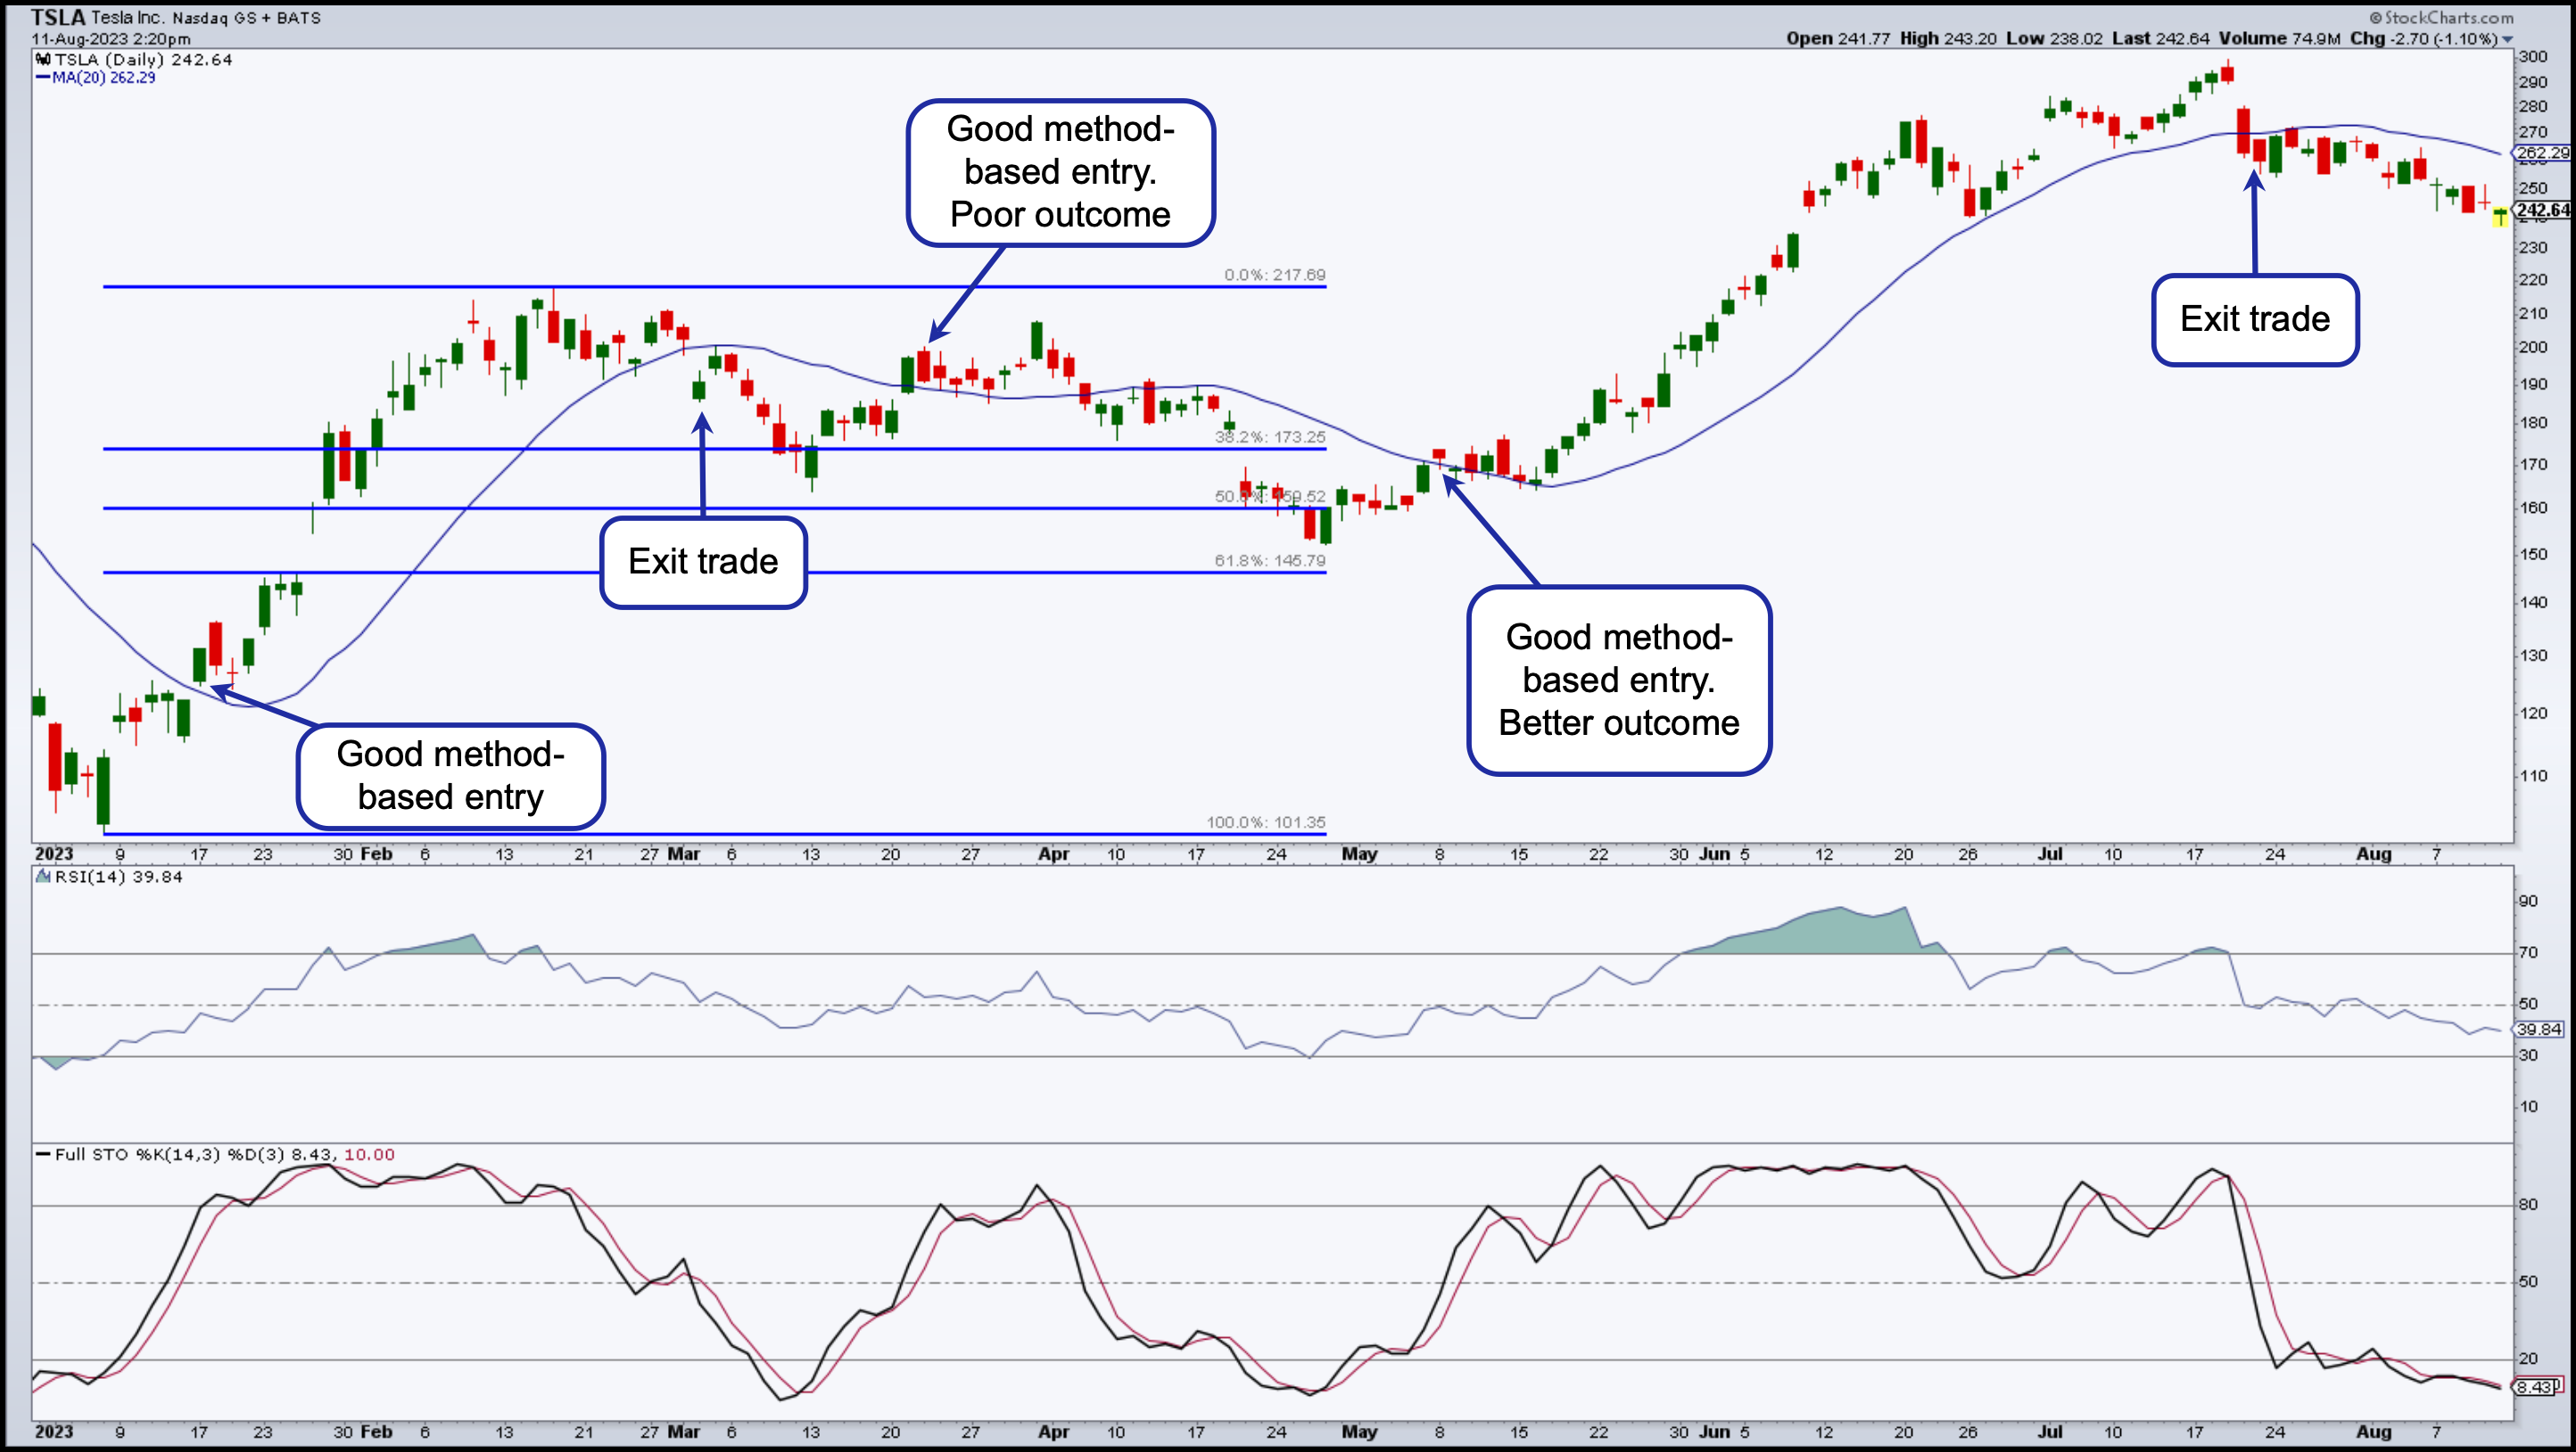
When TSLA prices crossed above the 20-day SMA, the RSI, and Stochastic Oscillator confirmed the bullish change in momentum. Entering a long position for this first trade would have yielded a favorable result, as we exited the position once prices closed below the 20-day SMA.
The second entry point was “correct” based on this method, but you might have been stopped out if you strictly followed the rules. This is where you have to stop and think whether a secondary context might help clarify the opportunity. You could plot a Fibonacci Retracement tool from the January bottom to the February swing high. The favorable “buying range” was between the 38.2% and 61.8% retracement window. If you had sold your position when prices crossed below the 20-day SMA, you would have lost money. However, this would have been unnecessary, given the perspective provided by the Fibonacci retracement tool.
The next trade would have been favorable, as the stock’s price is above the 61.8% Fib level. And as you can see, the trade itself, once you closed the position when prices crossed below the 20-day SMA, yielded a good return.
How To Trade a Bearish Price Crossover
Step 1. Confirm the Crossover Before making a move, ensure the price has conclusively crossed below the moving average.
Step 2. Check Supporting Context and Indicators Look for confluence with other technical indicators. For example, the RSI might indicate the asset is not yet oversold, or the Stochastic Oscillator could be showing a bearish crossover of its own. If the SMA is falling, it’s a bearish sign; but if the MA is rising, you should have a reason to take a bearish contrarian position.
Step 3. Check the Trading Volume A significant increase in volume shows bearish trend strength. If not, then tread carefully, as your chances of acting on a false signal are much greater (and this depends on the overall market context and other indicator readings).
Step 4. Determine Your Entry Point You can sell your long position or enter a short position after confirming the crossover and other signals. The exact entry point might vary based on personal strategy. Some traders prefer entering immediately upon confirmation, while others might wait for a breakout below the crossover candle or a retest of the moving average as resistance.
Step 5. Set Your Stop-Loss Place your stop-loss slightly above the SMA or the most recent swing high. This step ensures limited loss in case the crossover was a false signal.
Step 6. Determine Your Profit Target Set a take-profit based on a support level, a measured move, a trailing stop, or any strategically-determined target approach. You want to catch as much downside as possible while minimizing your downside risk.
CAVEAT: When going short, your risk is technically unlimited (unlike going long). So be extra careful when shorting stocks.
Example of Bearish Price Crossover

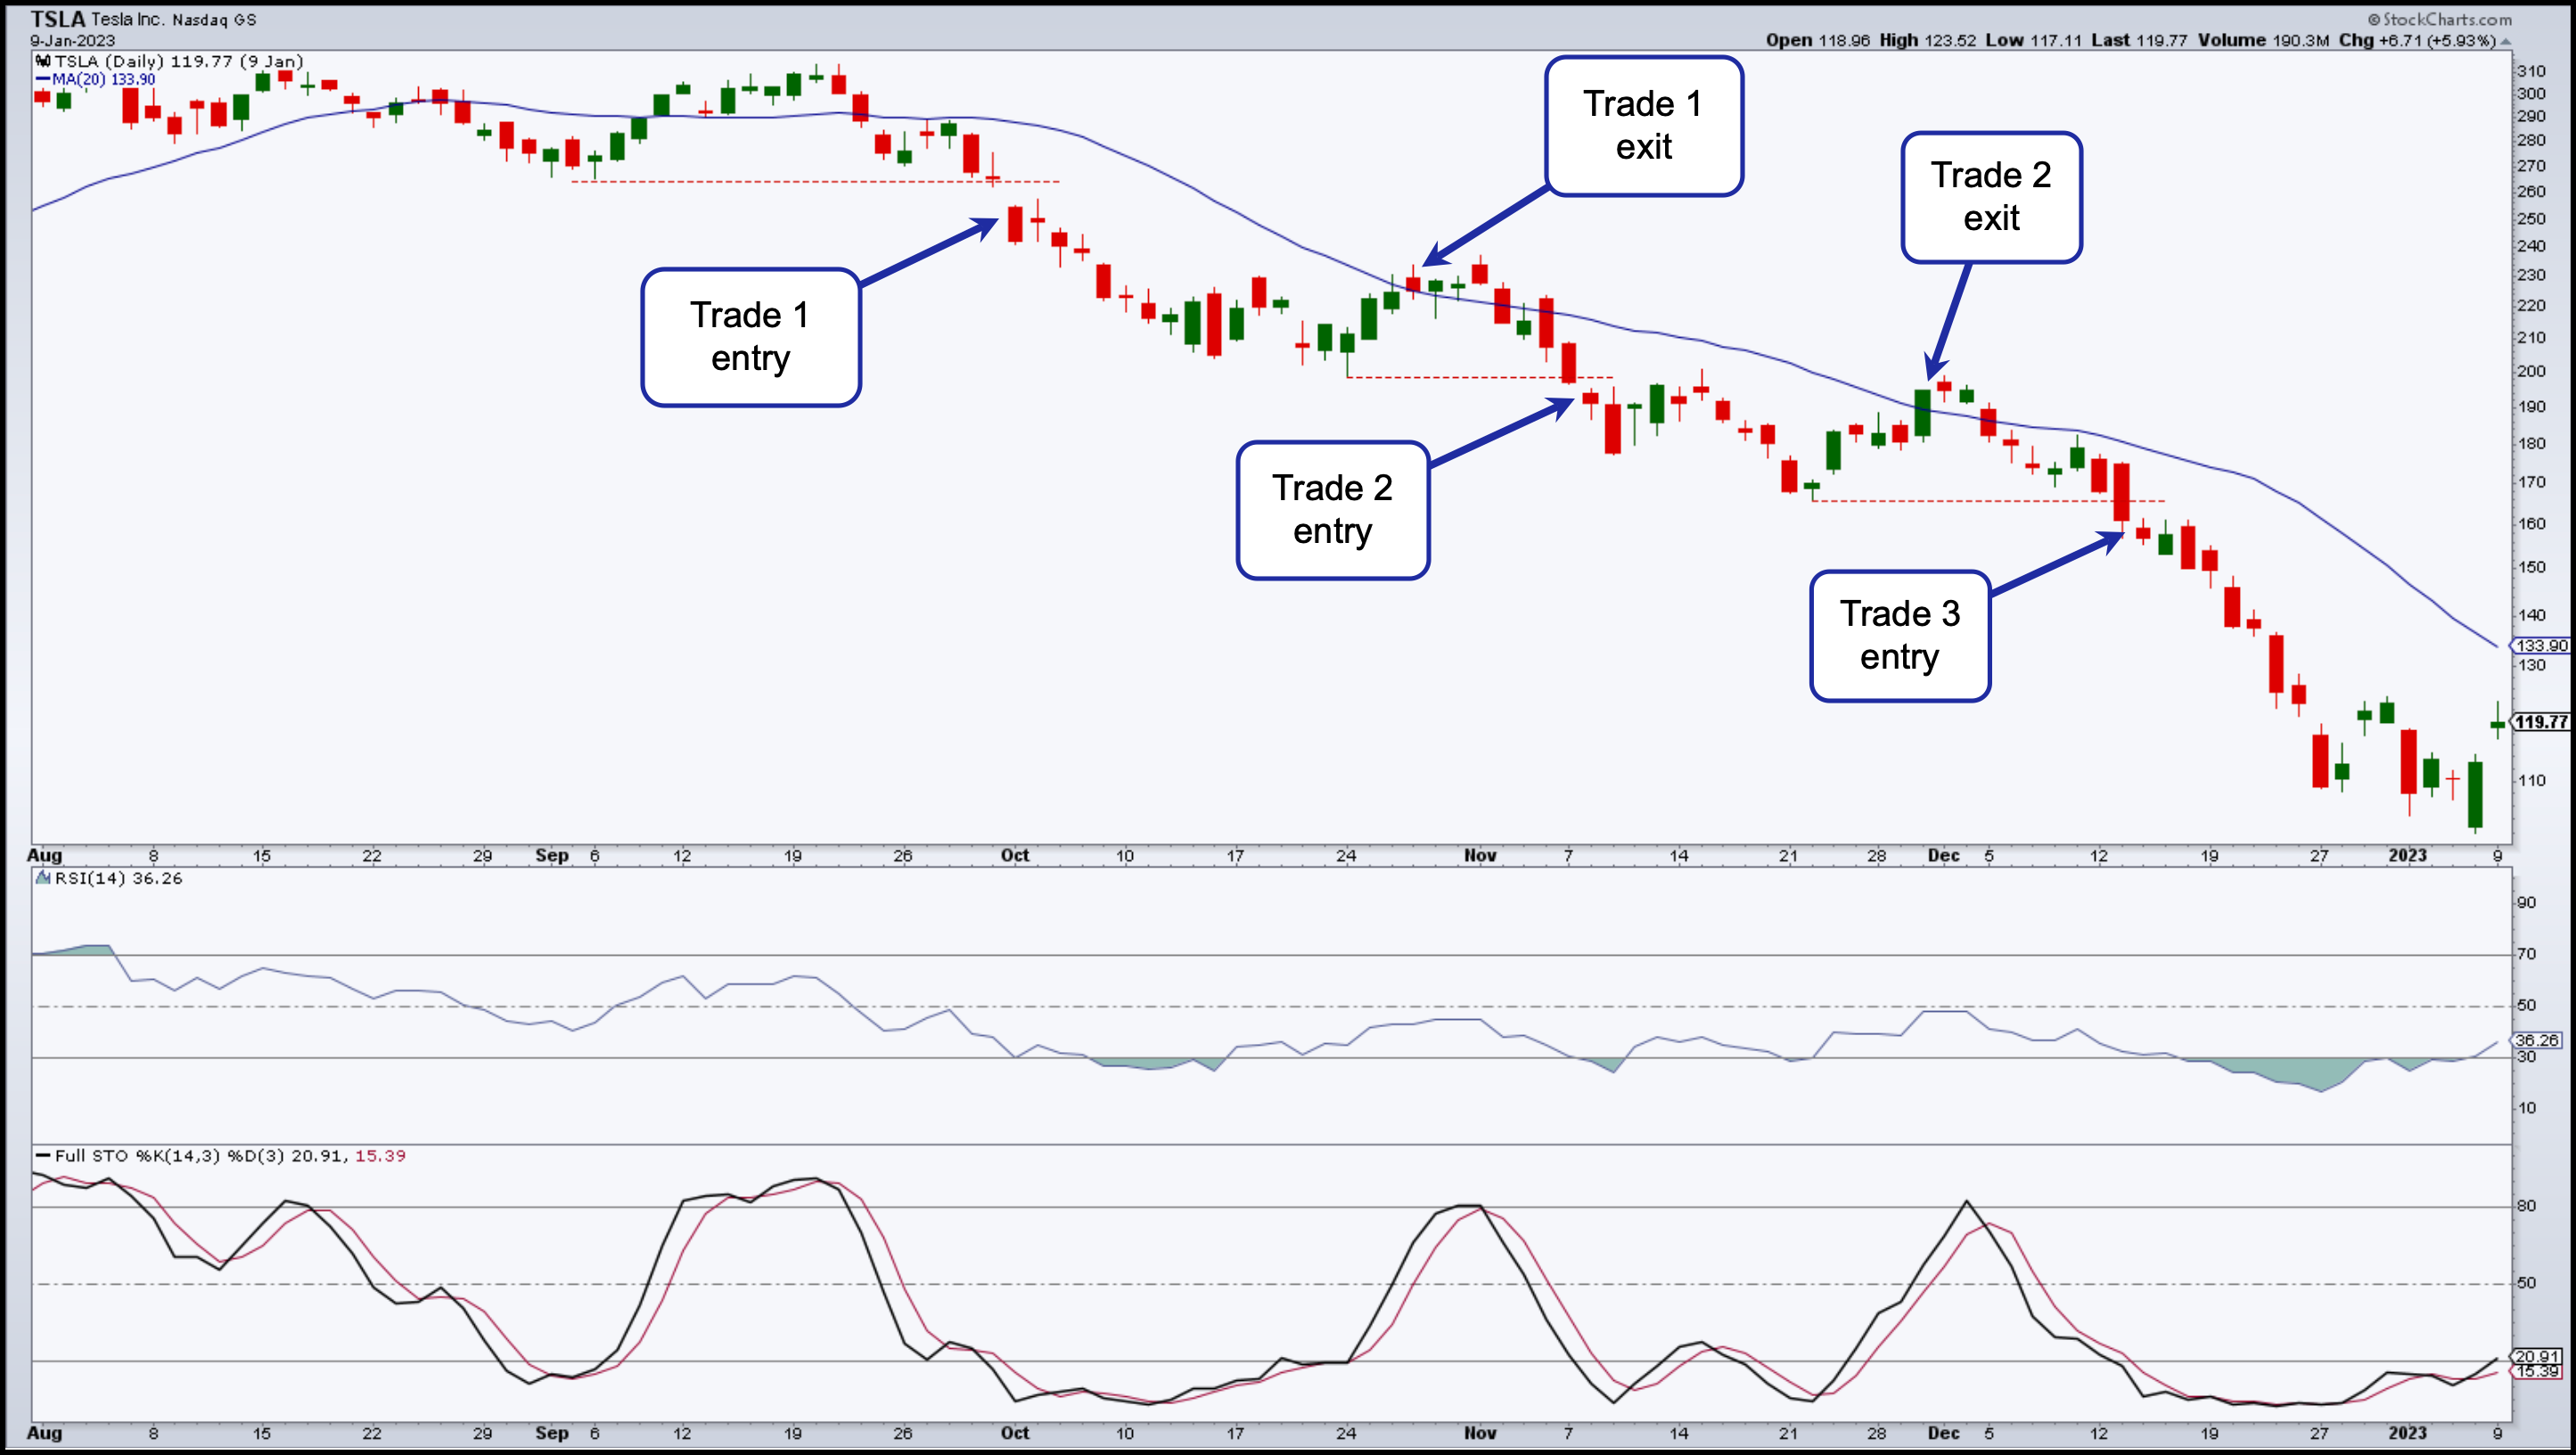
In the hypothetical example above, there are three short trades, but not immediately when price crossed below the 20-day SMA. The entry criteria were filtered by placing a sell-stop order upon a break below each swing low.
Imagine setting your stop loss at the top of the previous swing high. If you had set your profit target at 100% of the risk (swing high to entry point), each trade would have been profitable, but you wouldn’t have caught the larger swing.
If you decided to exit your short position when prices crossed above the 20-day SMA, the first and third trades would have yielded a profit, while the second would have been a break-even or a loss (once you factor in trading costs and commissions).
A Few Potential Pitfalls to Consider
Beware False Signals. Markets can be noisy, and not every crossover indicates a bullish or bearish trajectory. This is especially true in sideways markets, where you’ll likely get whipsawed. So, pay attention to the broader market conditions and use other indicators to confirm your bullish or bearish convictions.
Lagging Indicator. Since moving averages are based on past prices, they lag the market. When a crossover is confirmed, a significant part of the movement might already have happened. So, be flexible here, make aggressive entries when necessary, but always manage your risk when you do so.
Market Conditions. Crossovers work best in trending markets, bullish or bearish. In sideways markets, particularly volatile ones, crossover signals are more uncertain and less reliable.
Get an Edge
Capitalizing on price-to-moving average crossovers can give you an edge in spotting shifts in market momentum. While this strategy offers a systematic approach to exploiting these shifts, you should remain vigilant.
Not every crossover will work. False signals will sometimes mislead you into taking a bad trade. And that’s why you use other technical indicators and pay attention to the broader market context.
Also, by sticking to a disciplined risk management approach, you’ll be better positioned to avail the opportunities moving average crossovers present. As with all trading strategies, stay flexible and adaptive. And try to identify opportunities that offer greater rewards than risks.
