|
|
Table of Contents
Fibonacci Time Zones
What Are Fibonacci Time Zones?
Fibonacci Time Zones are a technical analysis tool designed to identify potential areas of price reversal using the Fibonacci sequence. The tool draws vertical lines to the right at each Fibonacci ratio, most commonly 23.6%, 38.2%, 50%, 61.8%, and 78.6%, based on significant swing highs and lows.
These lines extend along the date axis, marking expected intervals where reversals might occur based on the time that has passed. While the starting point often comes from a major low or high, the distances between these zones start relatively small and grow in accordance with the Fibonacci Sequence. Though not always pinpoint accurate, Fibonacci Time Zones are a valuable forecasting tool for anticipating potential price reversal points.
How Do the Sequence and Ratios Work?
This article is not designed to delve too deep into the mathematical properties behind the Fibonacci sequence and Golden Ratio. There are plenty of other sources for this detail. A few basics, however, will provide the necessary background for the most popular numbers. Leonardo Pisano Bogollo (1170-1250), an Italian mathematician from Pisa, is credited with introducing the Fibonacci sequence to the West. It is as follows:
0, 1, 1, 2, 3, 5, 8, 13, 21, 34, 55, 89, 144, 233, 377, 610……
The sequence extends to infinity and contains many unique mathematical properties.
- After 0 and 1, each number is the sum of the two prior numbers (1+2=3, 2+3=5, 5+8=13 8+13=21 etc…).
- A number divided by the previous number approximates 1.618 (21/13=1.6153, 34/21=1.6190, 55/34=1.6176, 89/55=1.6181). The approximation nears 1.6180 as the numbers increase.
- A number divided by the next highest number approximates .6180 (13/21=.6190, 21/34=.6176, 34/55=.6181, 55/89=.6179 etc….). The approximation nears .6180 as the numbers increase. This is the basis for the 61.8% retracement.
1.618 refers to the Golden Ratio or Golden Mean, also called Phi. The inverse of 1.618 is .618. These ratios can be found throughout nature, architecture, art, and biology. In his book, Elliott Wave Principle, Robert Prechter quotes William Hoffer from the December 1975 issue of Smithsonian Magazine:
….the proportion of .618034 to 1 is the mathematical basis for the shape of playing cards and the Parthenon, sunflowers and snail shells, Greek vases and the spiral galaxies of outer space. The Greeks based much of their art and architecture upon this proportion. They called it the golden mean.
How Do You Interpret Fibonacci Time Zones?
The slow start in the Fibonacci sequence creates relatively tight clustering at the beginning of the Fibonacci Time Zones. Sometimes, it is necessary to ignore the first five or so time zones as, after that point, the zones expand quite quickly as the sequence unfolds. According to the theory, potential reversal points can be found by looking ahead 21, 34, 55, 89, and 144 days, all of which are Fibonacci numbers. 21 days mark the 8th Fibonacci Time Zone. Some subsequent zones are listed below. Remember, you can find future time zones by adding the previous two time zones (89 + 144 = 233).
- 8th zone = 21 days or periods
- 9th zone = 34 days or periods
- 10th zone = 55 days or periods
- 11th zone = 89 days or periods
- 12th zone = 144 days or periods
- 13th zone = 233 days or periods
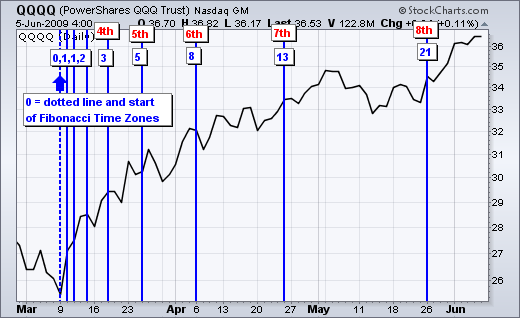
QQQQ Example
Chart 1 shows the Nasdaq 100 ETF (QQQQ) with the Fibonacci Time Zones extending from the March 2009 low, which was an important low. The first 7 time zones are difficult to use because of the tight clustering. The sequence gets some breathing room starting with the 8th time zone (21 days). The 9th time zone (34 days) coincided nicely with the July low. The 10th time zone (55 days) occurred in the middle of an uptrend and was not significant. The 11th time zone occurred near the February low.
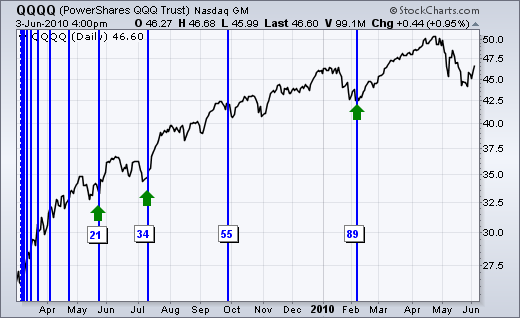
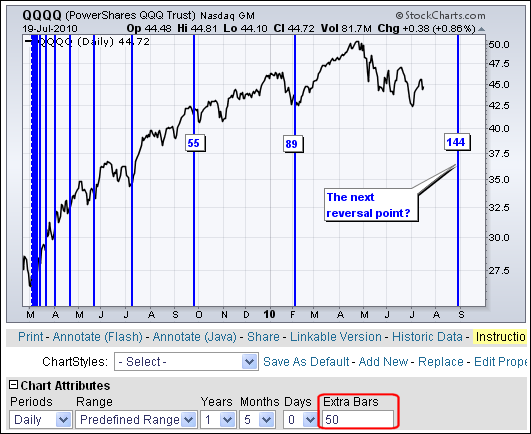
Chart 2 shows QQQQ with time added to see the next Fibonacci Time Zone. Under “chart attributes,” users can add “extra bars” to view future Fibonacci Time Zones. The next Fibonacci Time Zone comes at the 155-day mark at the beginning of September 2010. QQQQ has been trending lower since late April and this zone could mark an important low.
Euro Example
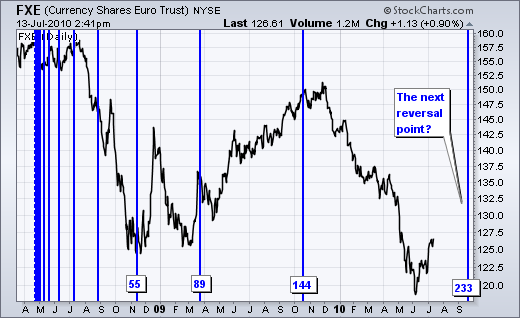
Chart 4 shows the Euro ETF (FXE) with the Fibonacci Time Zones extending from the April 2008 high, which marked a major high. The 8th Fibonacci Time Zone (21 days) marked a top in July, the 34-day line did not mark anything significant and the 55-day line marked a significant low. The March 2009 high formed just after the 89-day line and the November high was a month after the 144-day line. As with most forecasting and cycle tools, a little leeway is required, especially when the lengths grow longer.
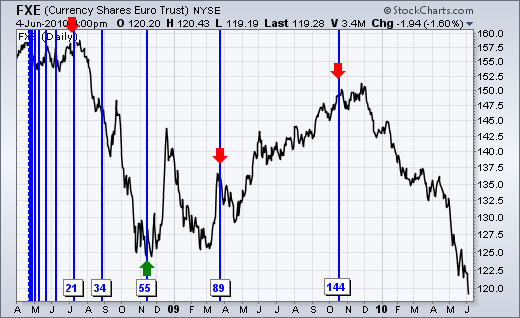
Chart 5 shows FXE with time added to see the next Fibonacci Time Zone at 233. Even though the Euro ETF bounced in June-July, another leg lower is still possible with the Fibonacci Time Zones forecasting a low in September 2010. 50 days were added to this chart to see the next Fibonacci Time Zone. After 233, the next line would be at day 377, which means the chart would need around 330 extra days for viewing.
The Bottom Line
Fibonacci Time Zones are called “zones” for a reason. They are not hard reversal points butpotential reversal points to watch as prices approach this zone. Fibonacci Time Zones provide a cross between cycle analysis and Fibonacci analysis. Both have a wide following, and turning points can be forecast weeks and months in advance. However, these forecast points serve as alerts for potential trend reversals. As these reversal points approach, chartists should turn to other aspects of technical analysis to confirm the reversal. This could be a bullish or bearish pattern, bullish or bearish candlesticks, bullish or bearish indicators or clues from the price chart itself.
SharpCharts
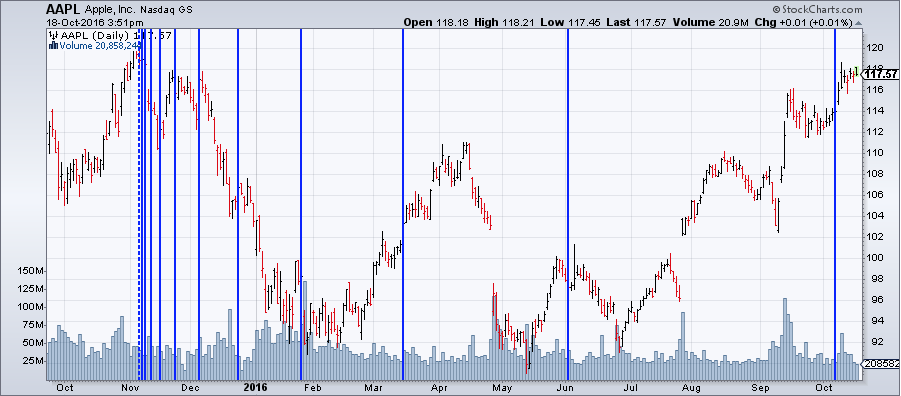
To add Fibonacci Time Zones to your charts, you can use our ChartNotes annotation tool. Below, you'll find an example of a chart annotated with Fibonacci Time Zones.
To learn more about how to add this annotation to your charts, check out our Support Center article on ChartNotes' Line Study Tools.
Fibonacci Time Zones
Which Fibonacci ratios are most commonly used for these time zones?
The most common ratios are 23.6%, 38.2%, 50%, 61.8%, and 78.6%.
How do Fibonacci Time Zones help in trading?
They mark expected intervals where price reversals might occur, offering traders potential entry or exit points.
Can you provide a brief about the Fibonacci sequence?
Starting from 0 and 1, each subsequent number is the sum of the two preceding numbers (e.g., 0, 1, 1, 2, 3, 5, 8…).
How accurate are Fibonacci Time Zones?
While they offer valuable insights, they aren't always pinpoint accurate. They serve as potential indicators rather than certainties.
Do Fibonacci Time Zones provide definite reversal points?
No, they are zones indicating potential reversals. Other technical analysis aspects should be used in conjunction to confirm reversals.

