Table of Contents
TA 101 - Part 8
This is the eighth part of a series of articles about technical analysis from a new course we're developing. If you are new to charting, these articles will give you the “big picture” behind the charts on our site. If you are an “old hand”, these articles will help ensure you haven't “strayed too far” from the basics. Enjoy!
(Click here to see the entire series.)
Trend Psychology
The psychology of fear and greed of market participants ultimately determines the direction of prices in a market. Prices rise with greed (demand) and fall with fear (supply). A price trend is simply a sustained directional price move. It can be thought of as a tilted support/resistance zone.
A trend will continue as long as either fear or greed is in control of a market. Trends fade or change direction as the balance of fear and greed changes. The extent of fear and greed in a market can be seen by how quickly prices are trending down or up.
Trending
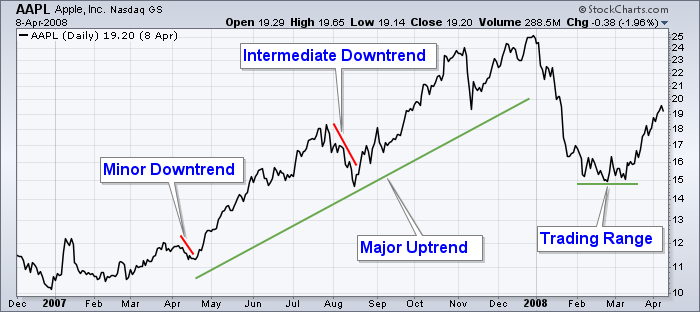
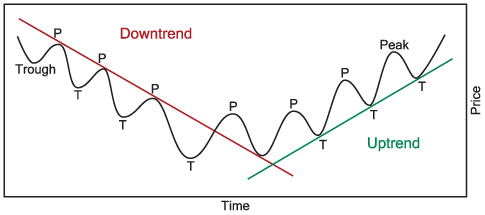
As stated earlier, a trend is a sustained, directional price move. Rising peaks and troughs constitute an uptrend; falling peaks and troughs constitute a downtrend. A trading range is characterized by horizontal peaks and troughs. Trends are generally classified into major (longer than six months), intermediate (one to six months), or minor (less than a month). Long term investors are most interested with identifying long-term trends where short-term investors are more interested in minor and intermediate trends. The following SharpChart shows examples of the different types and categories of trends.
Trend lines
A trend line is a straight line that connects two or more low or high price points and then extends into the future to act as a line of support or resistance. The first two points establish the trend line while additional points validate it.
The following SharpChart contains a real example of how an uptrend line is drawn with a trend change.
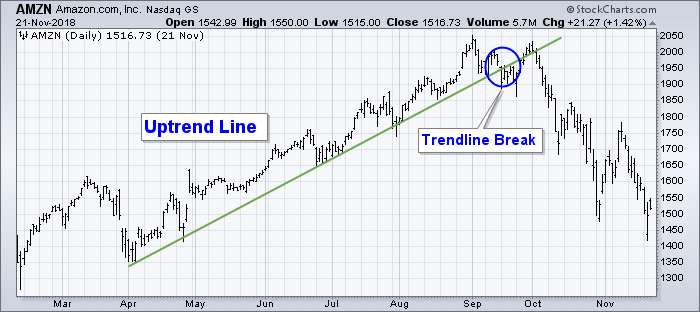
An uptrend line has a positive slope and is formed by connecting two or more low points. Uptrend lines act as support. As long as prices remain above the trend line, the uptrend is considered intact. A break below the uptrend line indicates that demand has weakened and a change in trend could be imminent.
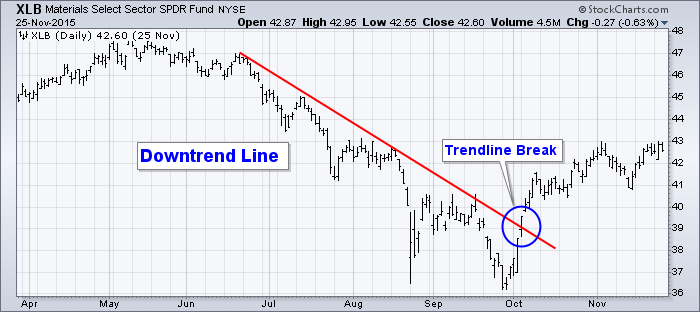
A downtrend line has a negative slope and is formed by connecting two or more high points. Downtrend lines act as resistance. As long as prices remain below the downtrend line, the downtrend is intact. A break above the downtrend line indicates that supply is decreasing and that a change of trend could be imminent.
Next time we'll look at trend channels and trend changes.