
|
Table of Contents
Chande Trend Meter (CTM)
Introduction
The Chande Trend Meter (CTM), developed by Tushar Chande, assigns a numerical score to a stock or other security, based on several different technical indicators covering six different timeframes. Distilling all this technical information down into a single number provides an easy way to identify the strength of the trend for a given security.
Calculation
The calculation of the Chande Trend Meter is based on the following technical indicators:
- The positions of the high, low and close relative to the Bollinger bands in four different timeframes (20-day, 50-day, 75-day and 100-day)
- The price change relative to the standard deviation over the past 100 days
- The 14-day RSI value
- The existence of any short-term (2-day) price channel breakouts
The resulting score is converted to a 0-100 scale for ease of comparison.
Interpretation
On the Chande Trend Meter scale of 0 to 100, stocks with a CTM score of 100 are in very strong uptrends. Conversely, stocks with a score of 0 are in very strong downtrends.
This scale can be divided into 5 different levels:
- Stocks with a score of 90-100 are in very strong uptrends
- Stocks with a score of 80-90 are in strong uptrends
- Stocks with a score of 60-80 are in weak uptrends
- Stocks with a score of 20-60 are either flat or in weak downtrends
- Stocks with a score of 0-20 are in very strong downtrends
Momentum traders should look for stocks with a Chande Trend Meter score of 80 or higher. This indicates a strong uptrend. The stronger the uptrend, the more likely it is to continue that trend.
The Chande Trend Meter can also be used with indexes and ETFs to get an idea of the relative trend for specific sectors and industries, or even entire markets.
One advantage of the Chande Trend Meter is that the value is set on an absolute scale, not relative to other stocks in a group. So, when you compare CTM scores of several different types of securities, you are making apples-to-apples comparisons across all securities.
Conclusion
The Chande Trend Meter provides a simple way to determine whether a stock is in an uptrend or a downtrend, and makes it easy to gauge the strength of that trend. By combining several different proven technical trend indicators and boiling them down into one number, the CTM gives chartists a wealth of trend information at a quick glance.
Using with SharpCharts
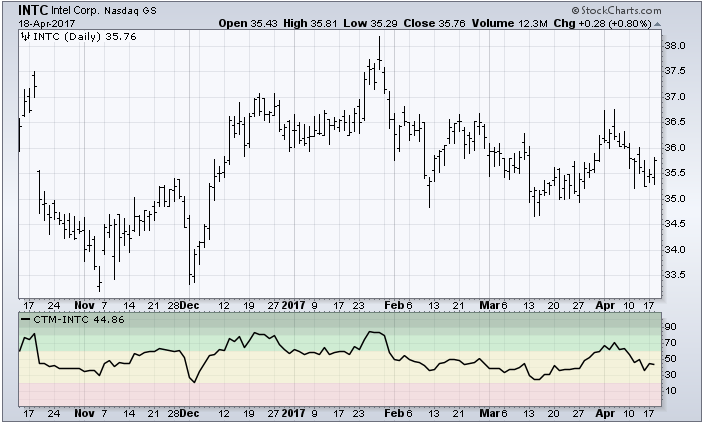
The Chande Trend Meter can be found in the Indicators section under the chart. The CTM indicator can be positioned above, below or behind the main price plot.
When placing above or below the main price plot, the background is color-coded to indicate the different trend strength levels:
- Dark Green: 90-100 (very strong uptrend)
- Medium Green: 80-90 (strong uptrend)
- Light Green: 60-80 (weak uptrend)
- Yellow: 20-60 (flat or weak downtrend)
- Pink: 0-20 (strong downtrend)
Suggested Scans
CTM Crosses Above 60 on Heavy Volume
This scan reveals stocks where the Chande Trend Meter has crossed above 60 with heavier than normal volume.
[type = stock] AND [country = US]
AND [Daily SMA(60,Daily Volume) > 100000]
AND [Daily SMA(60,Daily Close) > 20]

AND [Chande Trend Meter x 60.0]
AND [volume > SMA(50,volume) * 1.5]
Stocks with Consistently High CTM
This scan reveals stocks where the Chande Trend Meter for a US stock is consistently high, averaging 80 or more over the last 50 trading days.
[type = stock] AND [country = US]
AND [Daily SMA(60,Daily Volume) > 100000]
AND [Daily SMA(60,Daily Close) > 20]

AND [SMA(50,Chande Trend Meter) > 80.0]
For more details on the syntax to use for Chande Trend Meter scans, please see our Scanning Indicator Reference in the Support Center.