
|
Table of Contents
Distance From Highs
What Is the Distance From Highs Indicator?
During an uptrend, it can be helpful to know how far a security's price is relative to a previous high. It can give you some idea of how much higher a security’s price will move. And if you're a trader who likes to open a long position when price has broken above a significant high, then knowing how far price is from that high can be useful for timing your trade entries. The Distance From Highs indicator in StockChartsACP indicates how far a security's price is from its 52-week, 9-month, 6-month, or 3-month high.
Charting Distance From Highs
The Distance From Highs indicator can be charted on StockChartsACP. Here's how you add the indicator to your chart.
- From Chart Settings in the left menu bar, under Add Indicator, scroll down and click Distance From Highs.
- Select either the 52-week high, 9-month high, 6-month high, or 3-month high from the Distance From dropdown menu.
- From the High Definition dropdown menu, you can choose whether to use the closing high or intraday high.
- Select Line Style (auto, solid, dashed, histogram, area, dots, etc.).
- Select Color of your choice for the indicator display.
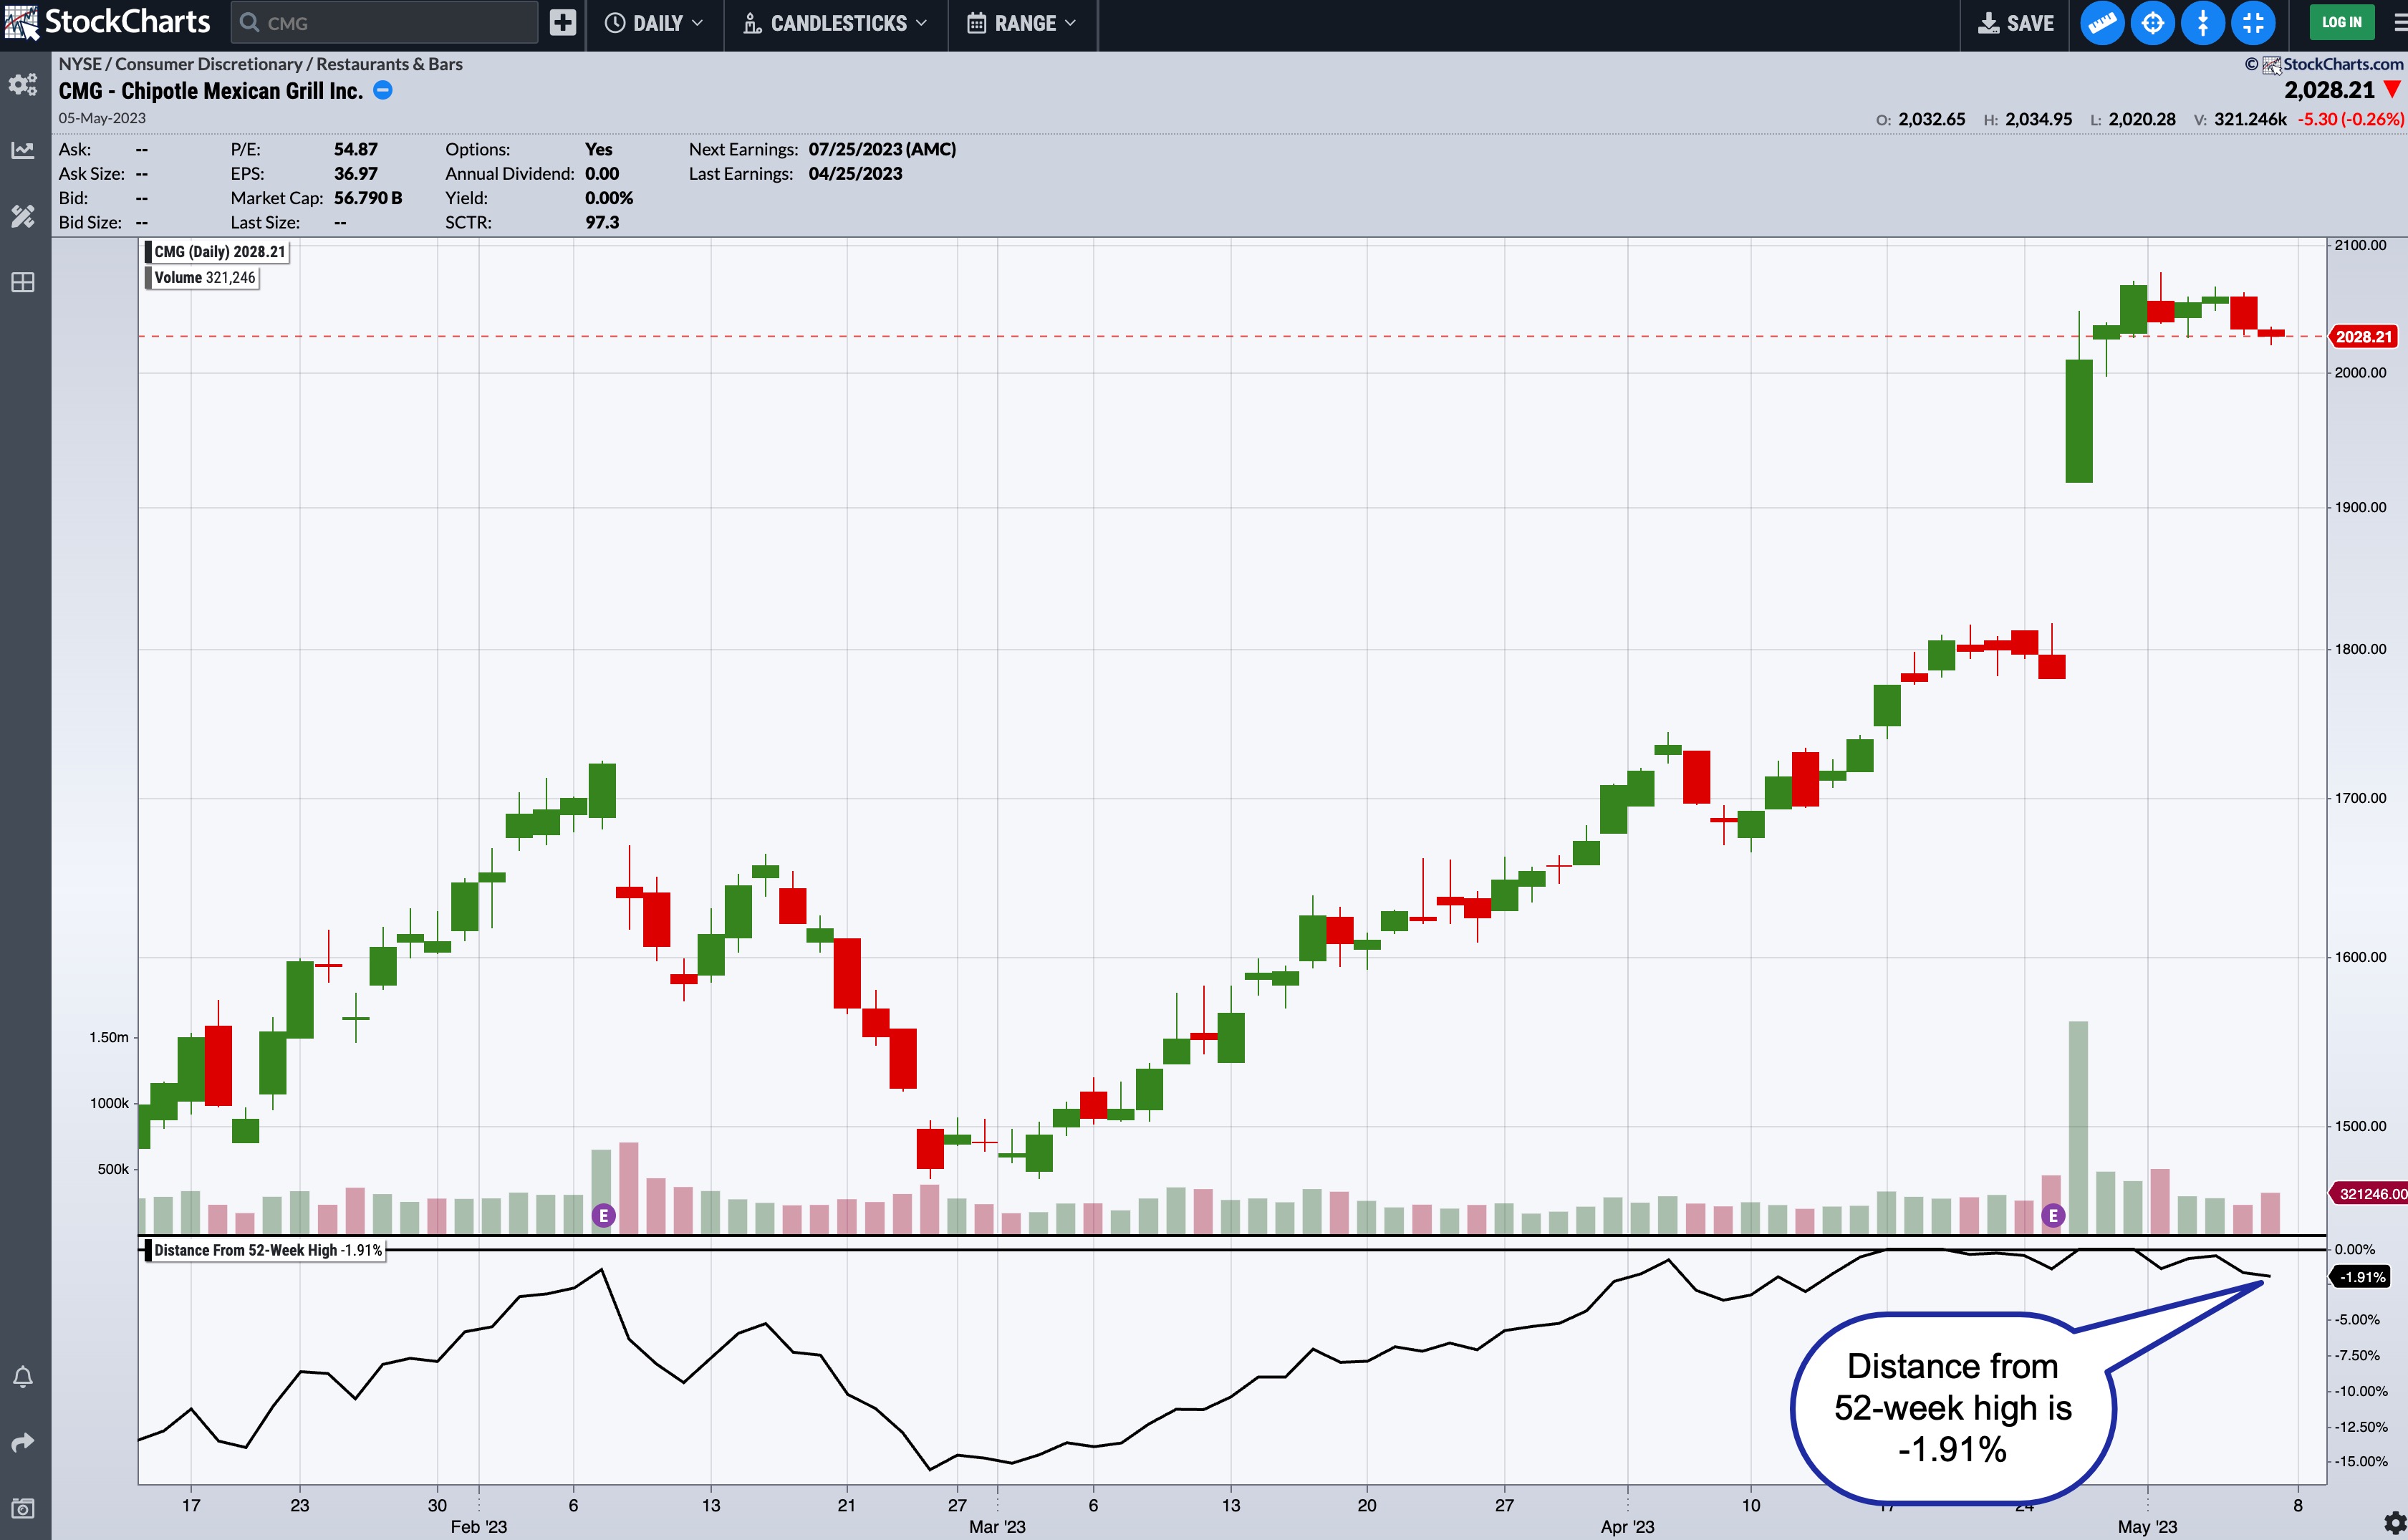
The indicator will be displayed in a separate panel that can be placed above the price, below the price, or overlaid on the price chart. If displayed in a separate panel you can see the distance from a high is expressed as a percentage. This is because using percentages makes it easier to compare different securities across different timeframes. For example, in the chart below, price recently hit a 52-week high and is now pulling back. The Distance From 52-Week High indicator shows that price is 1.91% below its 52-week high.
You could scroll through your ChartLists and identify securities close to their 52-week, 9-month, 6-month, or 3-month highs. That will give you an idea of how far price is from a specific high and how much price could move.