
|
Table of Contents
Distance From Lows
What Is the Distance From Lows Indicator?
During a downtrend, knowing how far a security's price is relative to a previous low can give you an idea of how much lower price will likely fall. It could help time your entries and exits. The Distance From Lows indicator in StockChartsACP indicates how far a security's price is from its 52-week, 9-month, 6-month, or 3-month low.
Charting Distance From Lows
The Distance From Lows indicator can be charted in StockChartsACP. Here's how you add the indicator to a price chart.
- From Chart Settings in the left menu bar, under Add Indicator, scroll down and click Distance From Lows.
- Select either 52-week, 9-month, 6-month, or 3-month low from the Distance From dropdown menu.
- You can use the closing low or intraday low from the Low Definition dropdown menu.
- Select Line Style (line, histogram, area, dots).
- Select Color for the indicator display.
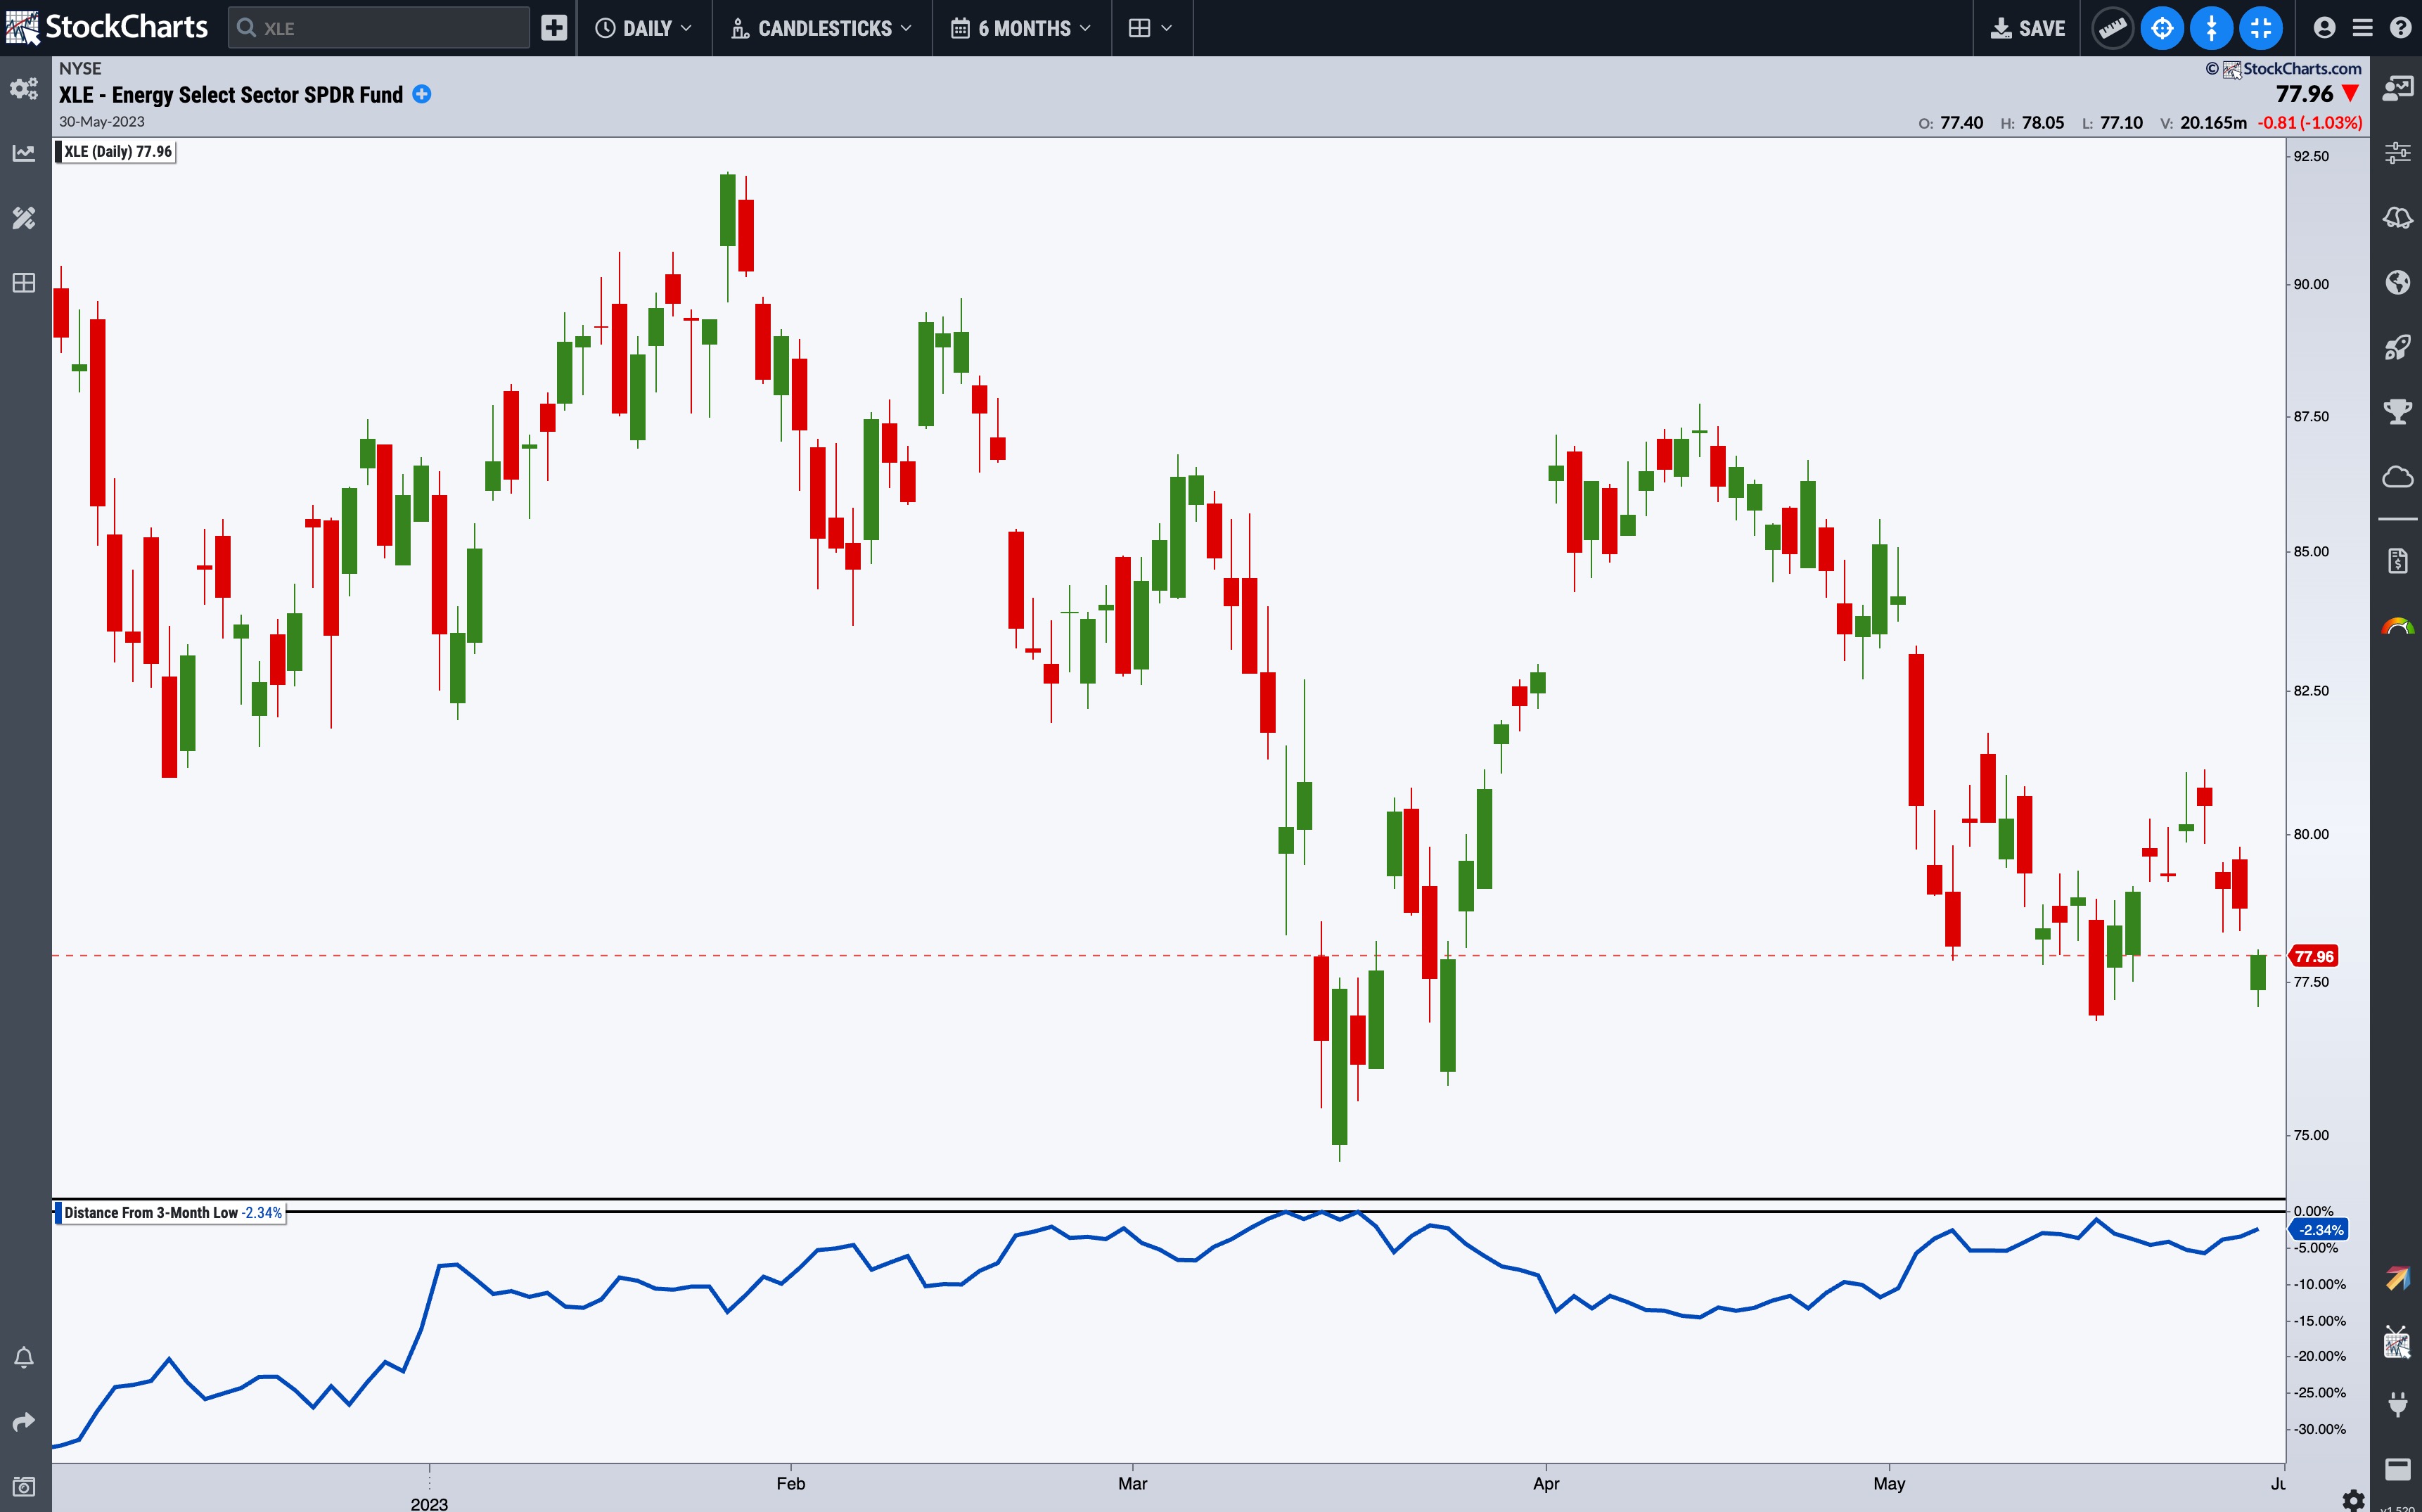
The indicator will be displayed in a separate panel that can be placed above the price, below the price, or overlaid on the price chart. When displayed in a separate panel, the distance from a low is expressed as a percentage. This helps to compare different securities across different timeframes.
The chart of the Energy Select Sector SPDR Fund (XLE) below shows that the ETF is -2.34% from its 3-month low. What does this indicate?
Applying the Distance From Lows Indicator
From Your Dashboard, you see that the Sector Summary shows that the Energy sector is the worst-performing sector for the week. If XLE is trading close to its 3-month low, it should alert you to a potential reversal to the upside. It may be a good time to set up a ChartList of energy stocks. If the Energy sector reverses, you'll be better prepared to position your portfolio to include some energy stocks that you could pick up at a good value.