
|
Table of Contents
Distance To Highs
What Is the Distance To Highs Indicator?
When a security is trending higher, and you’re considering buying it, you may want to know how much further price will have to move to reach its 52-week, 9-month, 6-month, or 3-month high. That’s what the Distance To Highs tells you.
Plotting the Distance To Highs in a subchart helps to quickly determine how much further price has to go to reach a specific past high. This can be especially helpful if a stock is trending higher. Some traders prefer to buy a stock after it has crossed above its 52-week high as long as there’s follow through to the upside. Others may prefer to use a shorter time frame.
Charting Distance To Highs
The Distance To Highs indicator can be added to a chart in StockChartsACP. Here's how to add the indicator to a chart.
- From Chart Settings found in the left menu bar, under Add Indicator, scroll down and select Distance To Highs.
- Then select either 52-week high, 9-month high, 6-month high, or 3-month high from the Distance To dropdown menu.
- Choose from closing high or intraday high from the High Definition dropdown menu.
- Select Line Style.
- Select Color for the indicator.
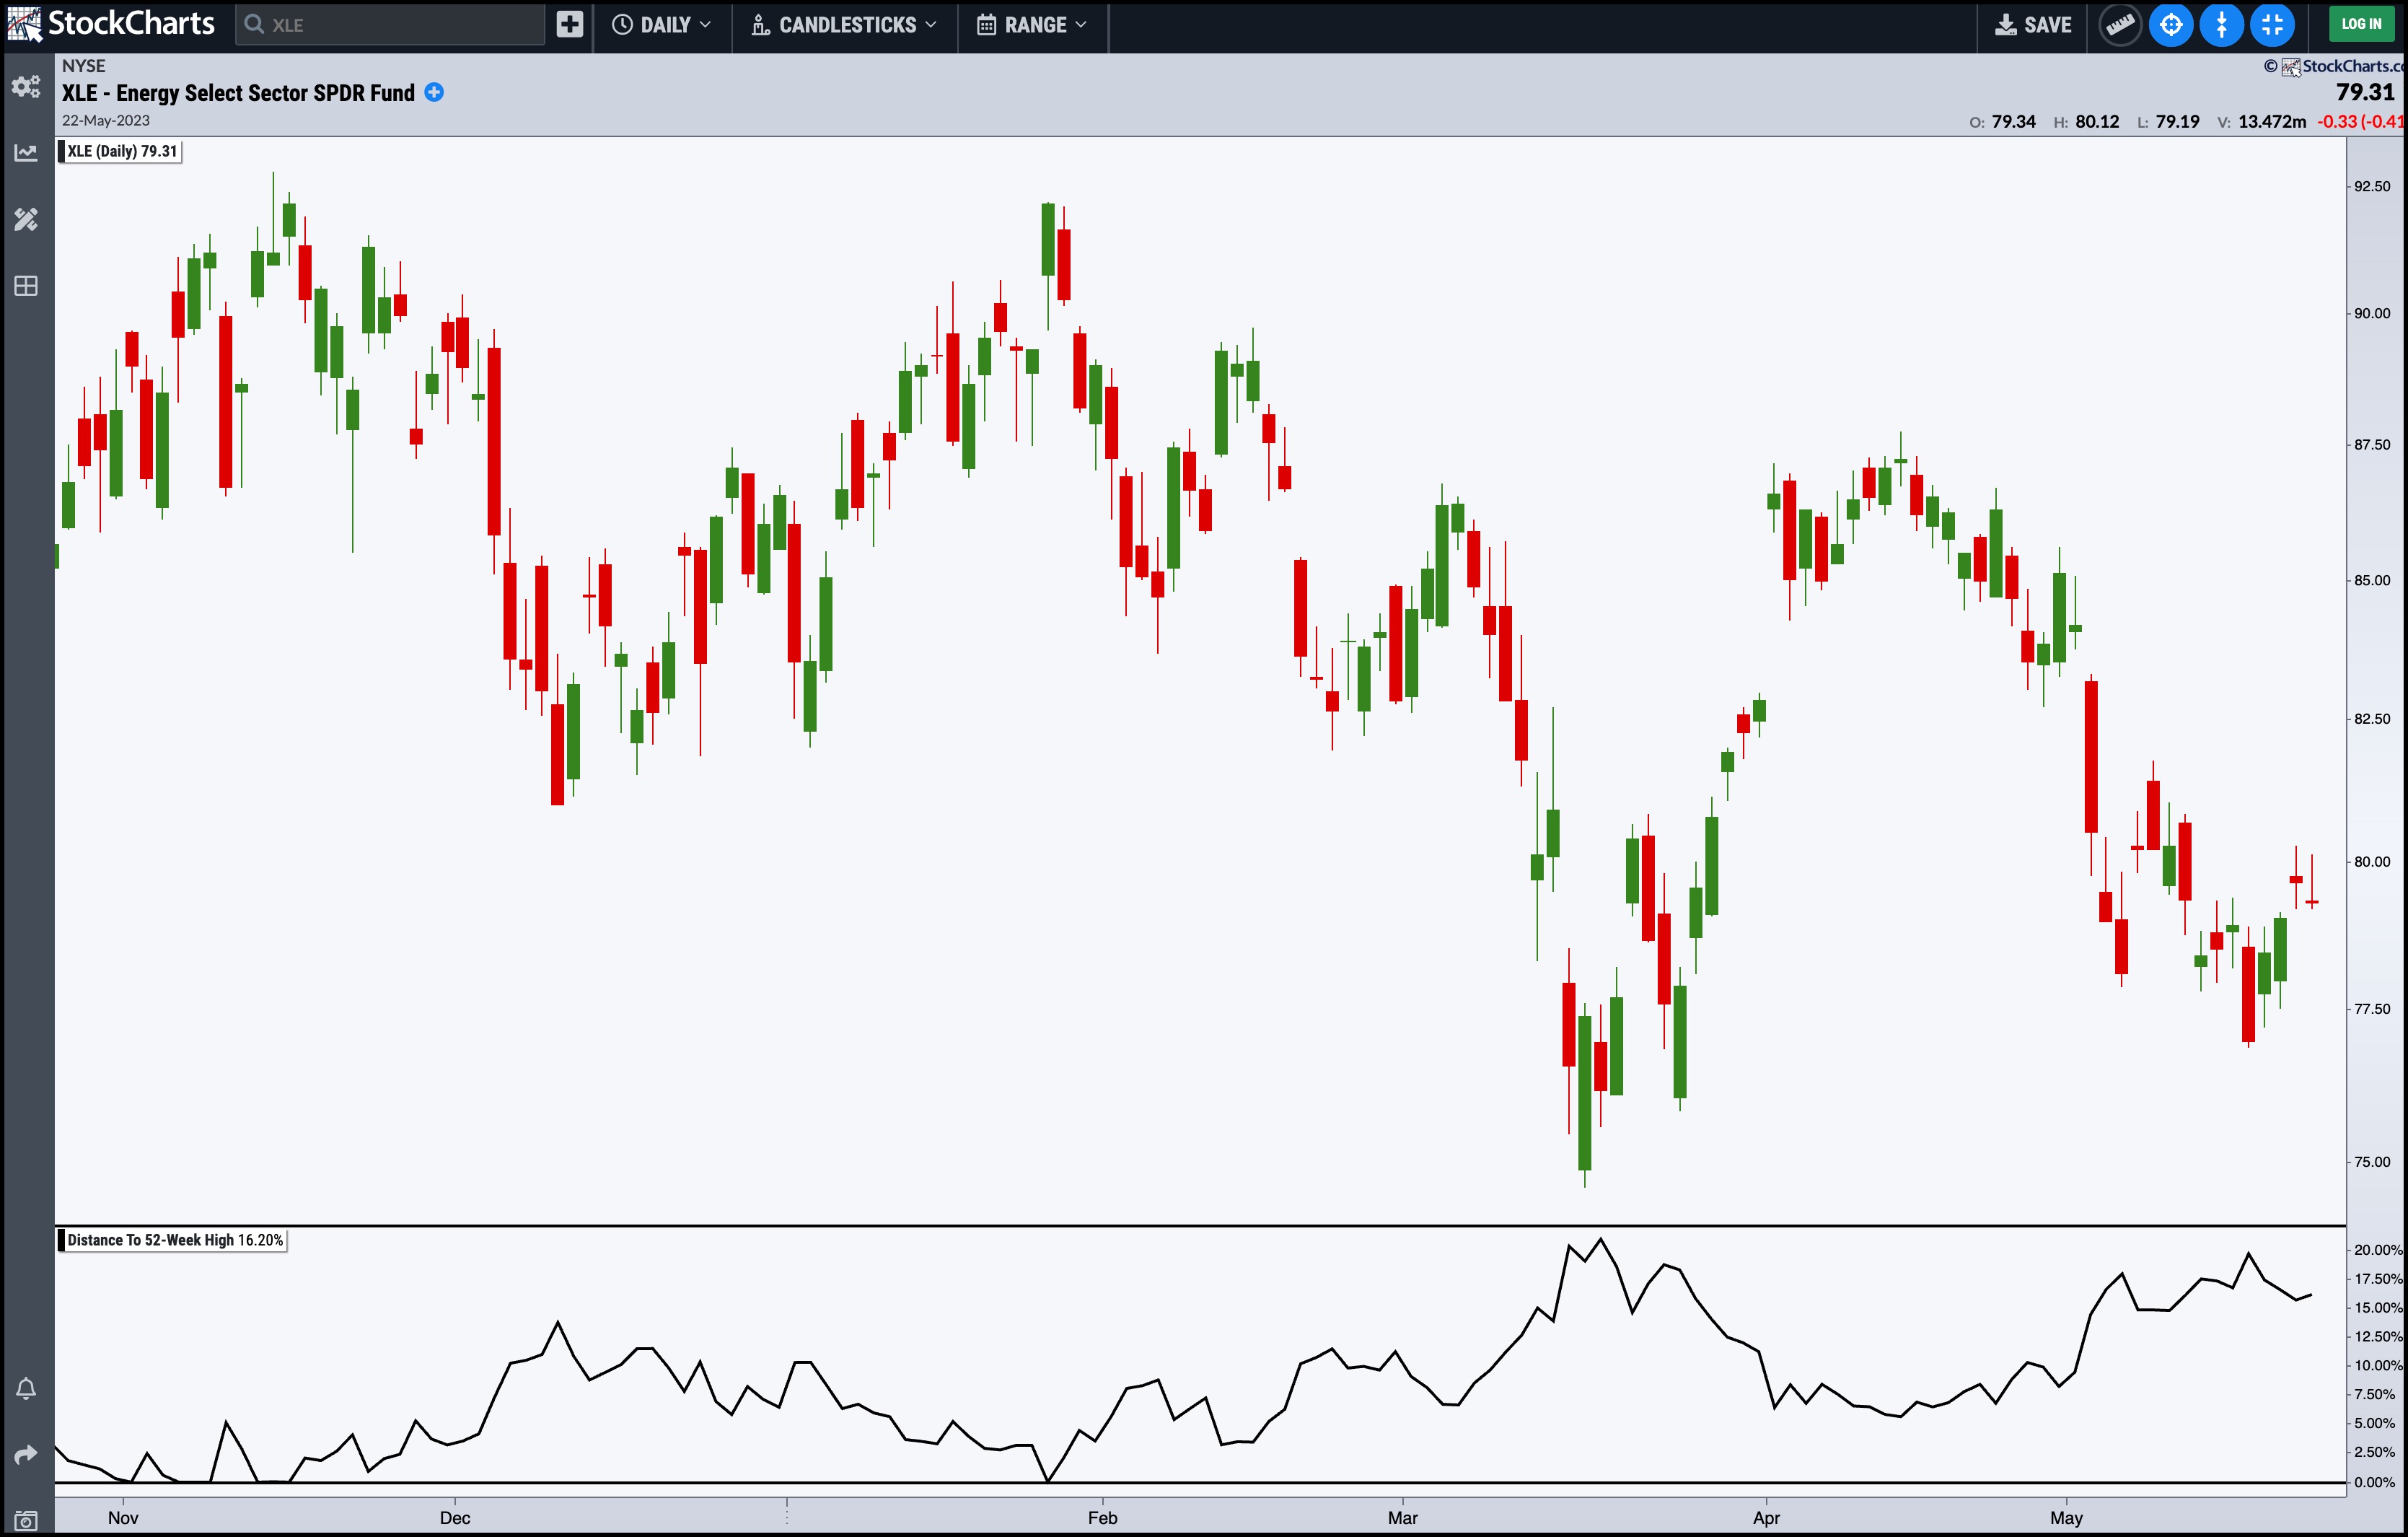
The Distance To Highs indicator will be displayed in a separate panel that can be placed above or below the price. You could also overlay the indicator on the price chart. When displayed in a separate panel, the Distance To Highs is expressed as a percentage.
In the chart below, the Distance To 52-Week High indicator is at 16.2%, which is pretty close to its one-year high.
Trading With the Distance To Highs Indicator
The Distance To High Indicator can be helpful in identifying stocks that are trending higher and may be close to a specific high. If you like to trade stocks that break out from a significant high, you could use the Distance To Highs indicator to identify stocks to trade.