
|
Table of Contents
Distance To Lows
What Is the Distance To Lows Indicator?
When a security's price is trending lower, you may wonder how much lower it’ll go. The Distance To Lows indicator can help identify where a security is trading relative to its 52-week, 9-month, 6-month, or 3-month low. The value of the indicator gives you an idea of how far the prevailing price is from a specific low.
Charting Distance To Lows
In StockChartsACP, enter a symbol to bring up a chart. Select Distance to Lows from the Standard Indicator List. The indicator, by default, will display in the lower panel below the price chart.
You can change the indicator settings by clicking the settings icon next to the indicator name. From the Distance To dropdown menu, select either Distance To 52-Week Low, 9-Month Low, 6-Month Low, or 3-Month Low. Then select whether you want to use the closing low or intraday low from the Low Definition dropdown menu. Then select the line style and color for the indicator display. You can plot the indicator as a line, histogram, area chart, or as dots.
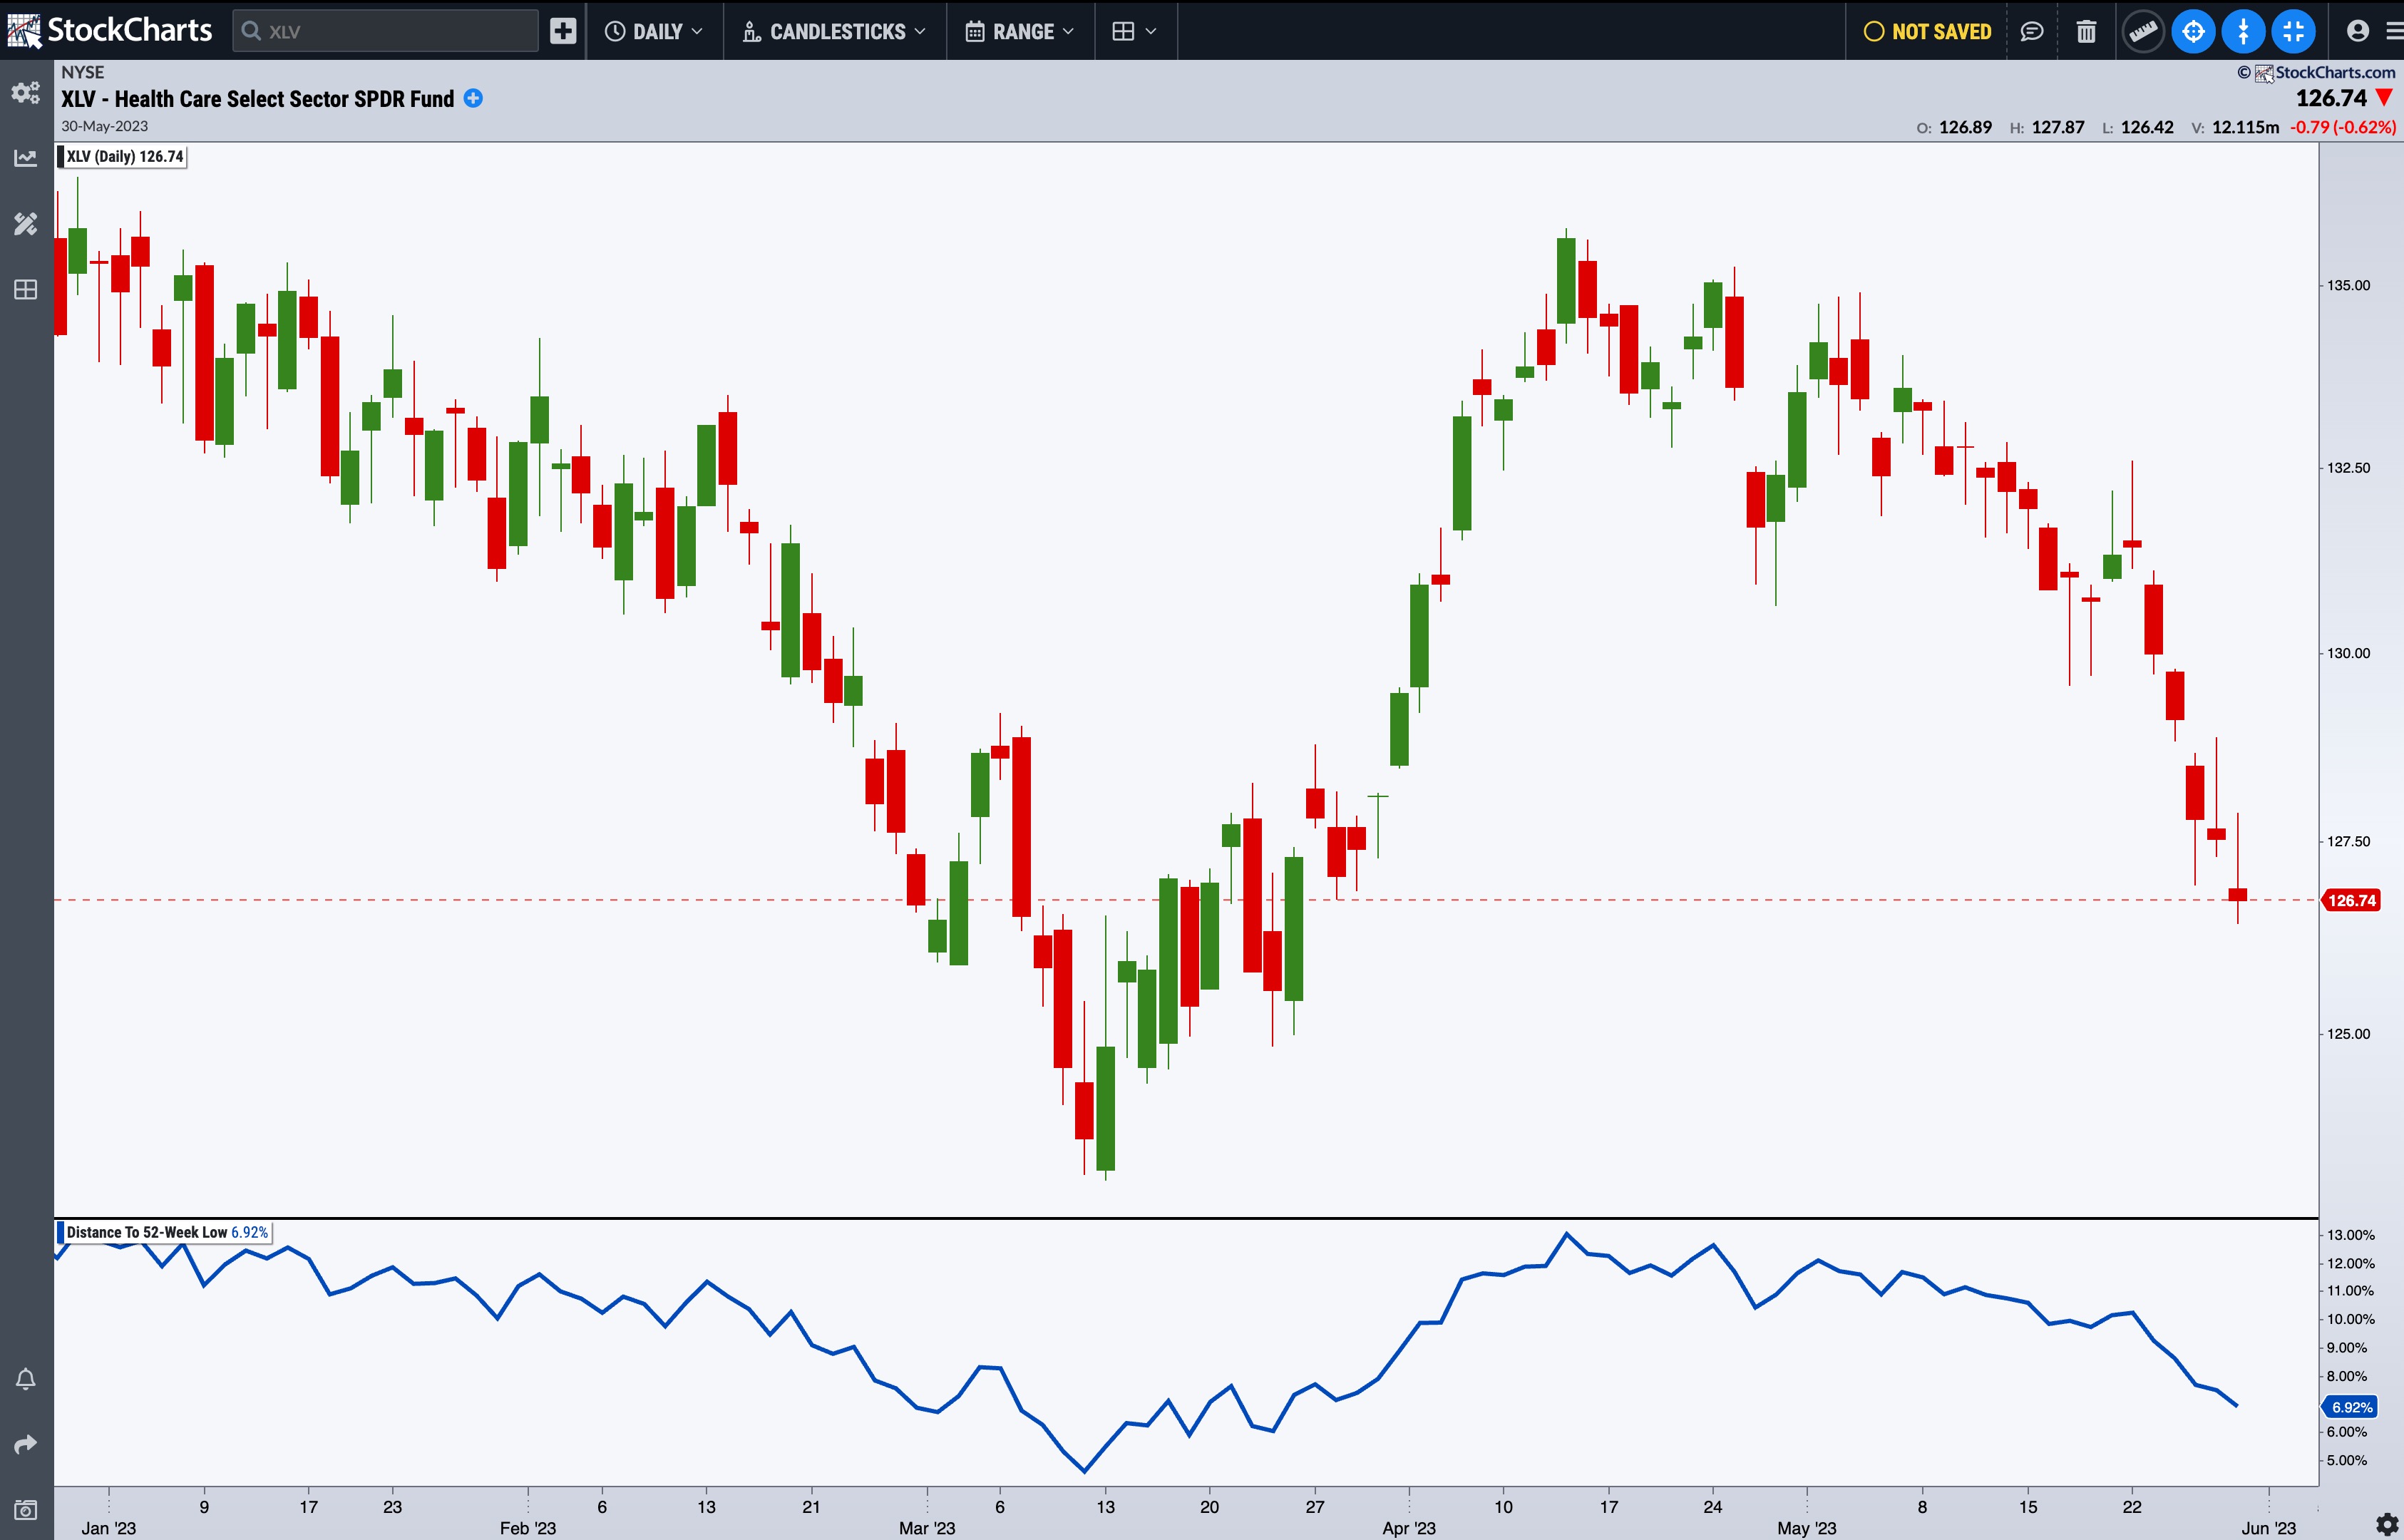
In the chart of the Health Care Select Sector SPDR ETF (XLV), the Distance To 52-Week Low is 6.92%. This suggests that the ETF's price is close to its 52-week low.
Trading With Distance To Lows Indicator
The Distance To Lows indicator can help identify downward trending stocks that may reverse sometime in the near future. For example, a stock that's trading close to its 52-week low could potentially reverse. When the stock shows signs of reversing, you could add the stock to one of your ChartLists and watch for signs of a price reversal follow-through.