
|
Table of Contents
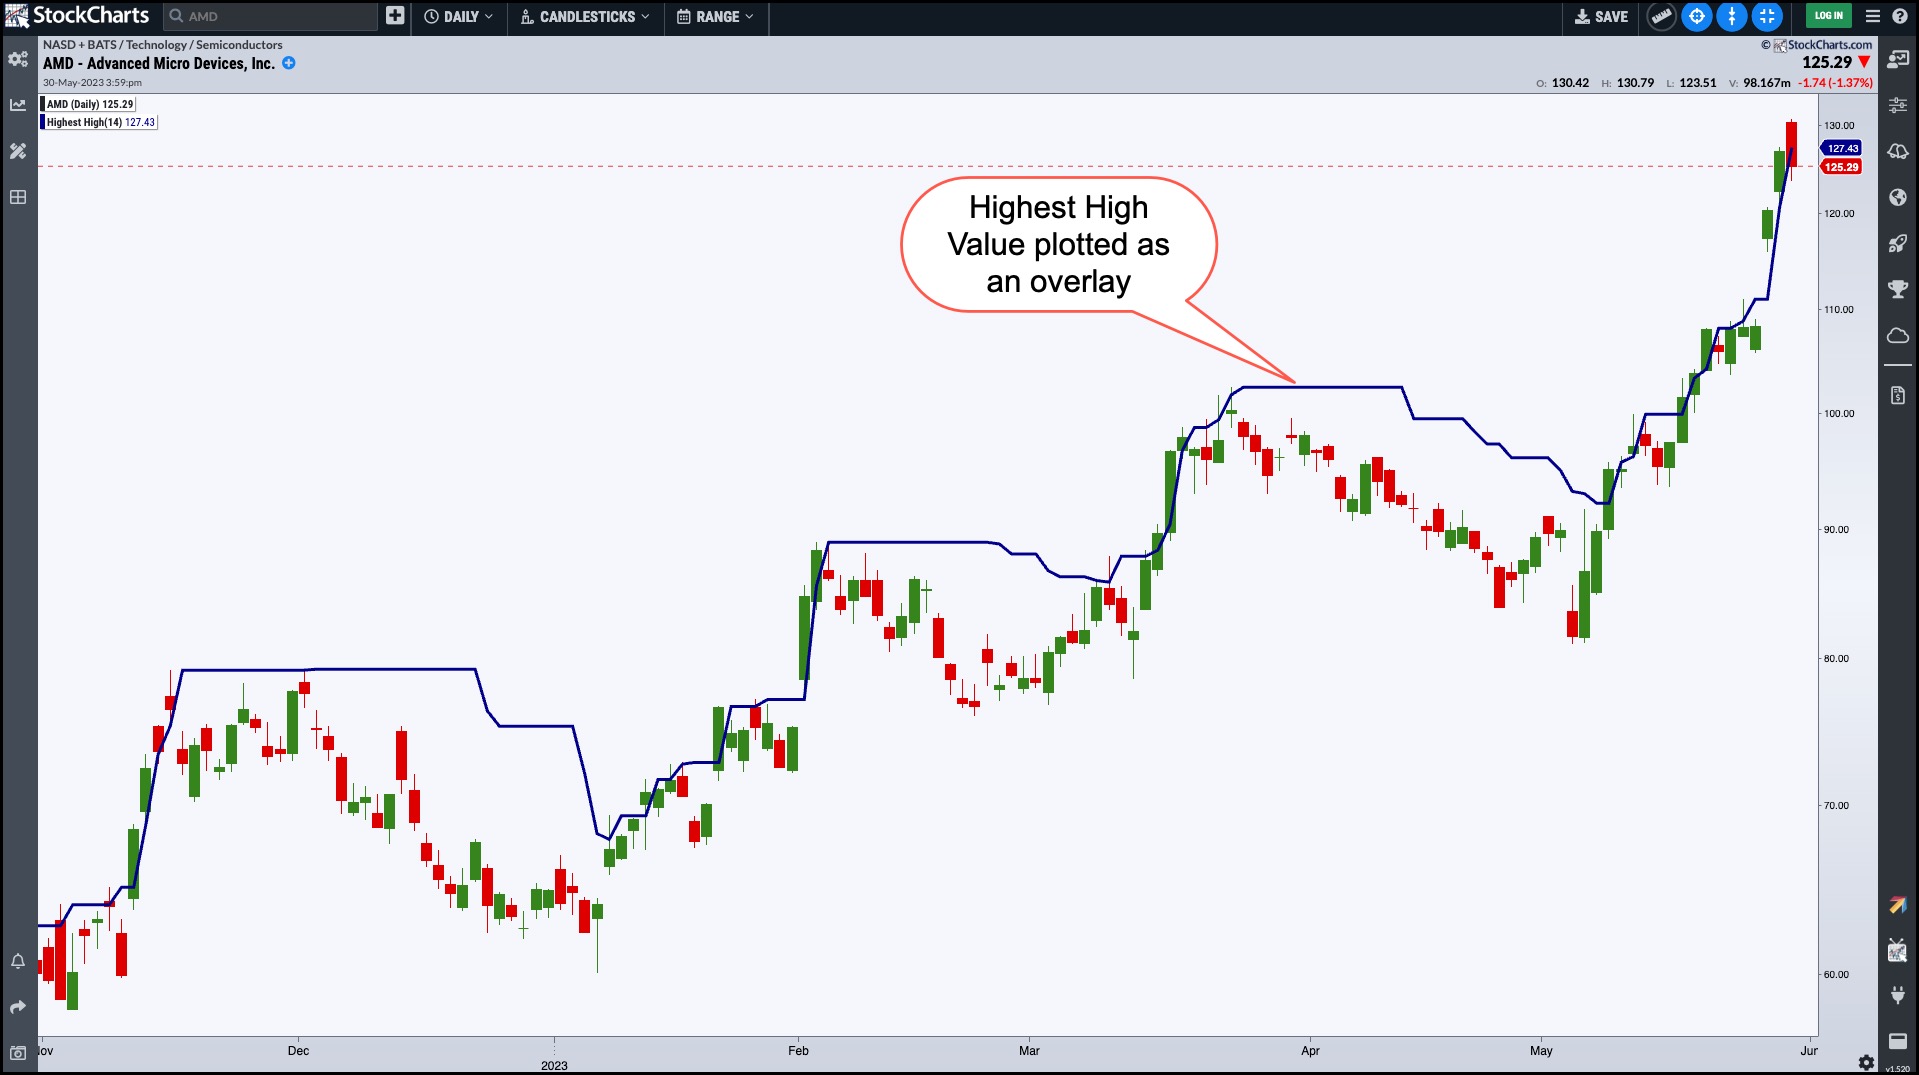
Highest High Value
What is the Highest High Value Indicator?
The Highest High Value indicator plots the highest price reached in a specific number of periods. The default period is 14 but you can change that in the StockChartsACP platform.
Charting the Highest High Value Indicator
The Highest High Value is plotted as an overlay on the price chart.
- In the StockChartsACP platform, enter a symbol.
- Scroll down in the Add Indicator section and select Highest High Value.
- Under the HHV settings, select the number of periods to use, line style, opacity, color, and an overlay for the HHV.
- The HHV is plotted as a line that touches the highest high values of the specified periods.
Trading With HHV
Since the Highest High Value represents the highest high observed over several periods, you could use it to make entry and exit decisions. For example, if price breaks through the upper band, it could indicate that price will continue moving higher if the Highest High Value continues to move higher. If the indicator flattens out and starts turning lower, it could indicate an overbought condition. This could be an alert to exit a long position.
To help determine an exit point, it helps to add the Lowest Low Value.