
|
Table of Contents
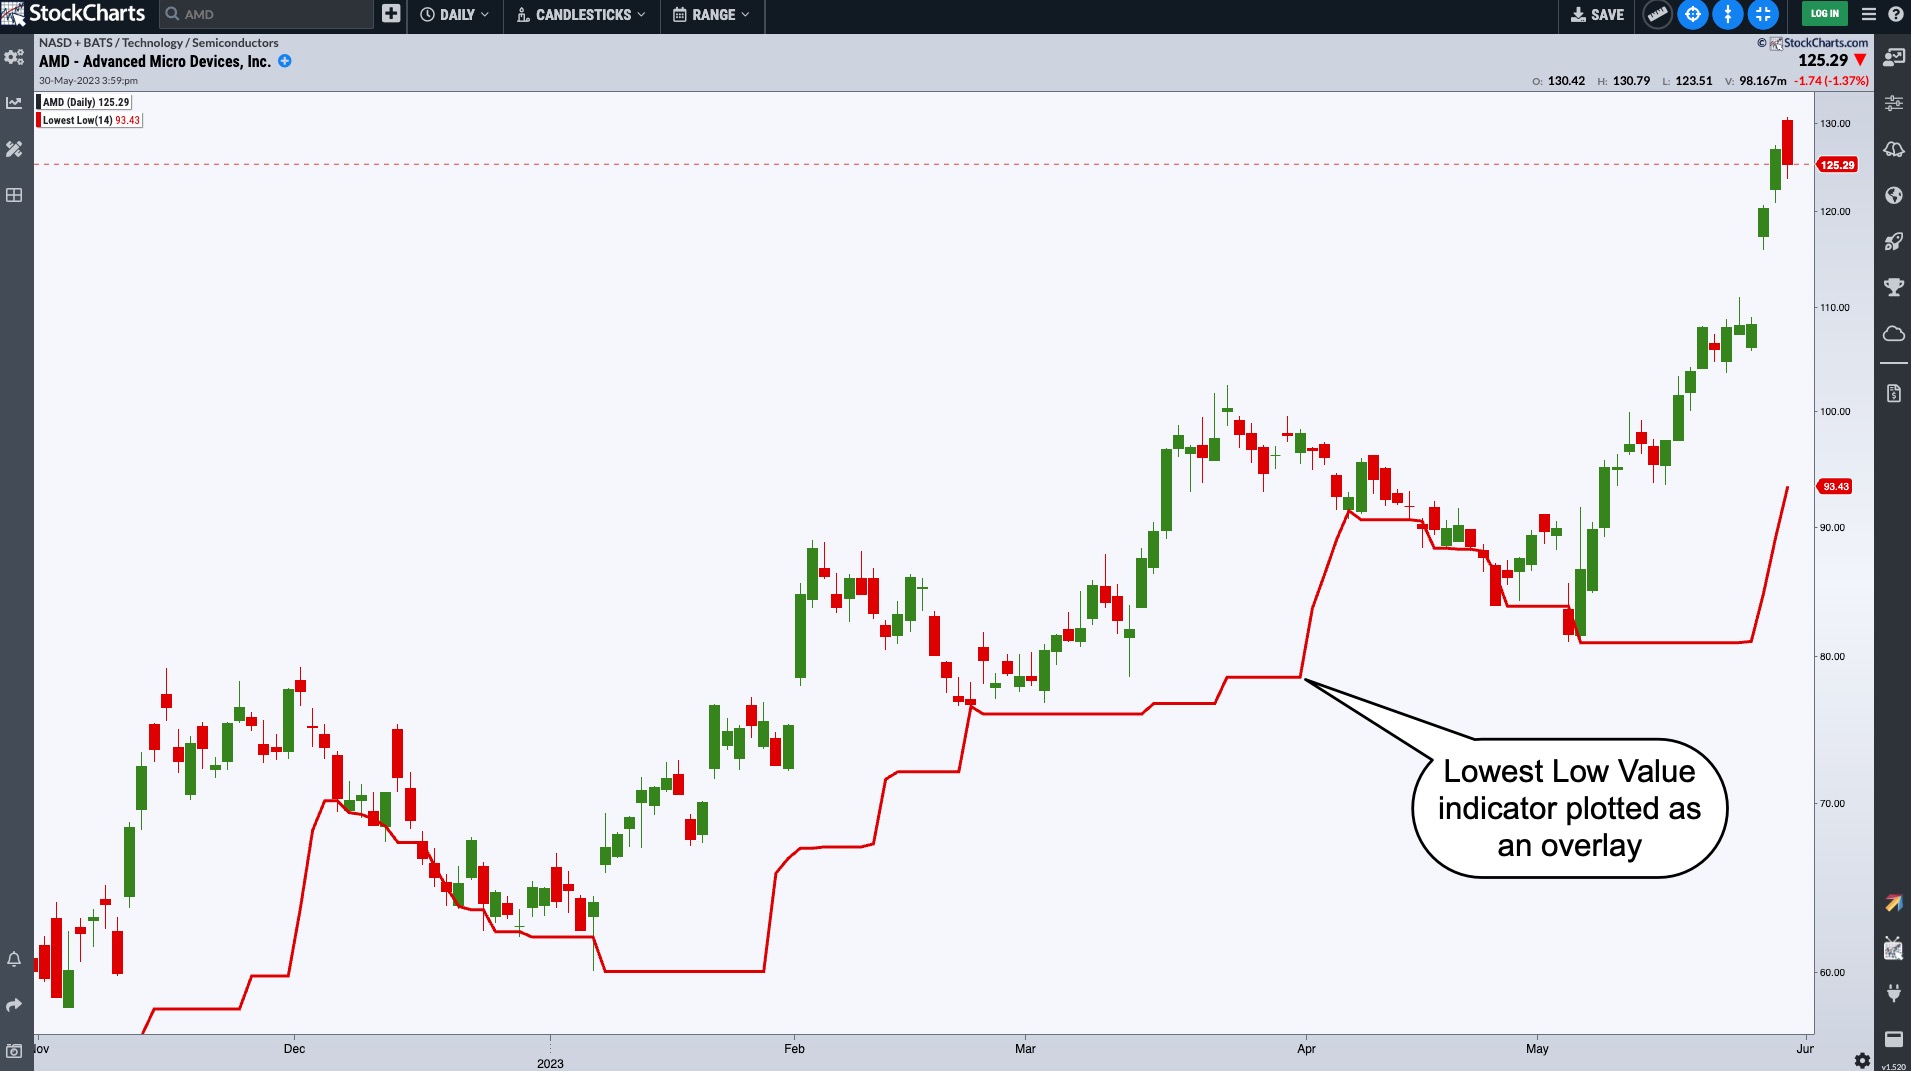
Lowest Low Value
What Is the Lowest Low Value Indicator?
The lowest low value is the lowest low observed over a number of periods. The default period is set to 14, but that parameter can easily be changed in StockChartsACP.
Charting the Lowest Low Value
The Lowest Low Value indicator is plotted as an overlay on the price chart.
- In StockChartsACP, enter a symbol.
- Scroll down in the Add Indicator section and select Lowest Low Value.
- Under Lowest Low Value settings, select the number of periods to use, the line style, opacity, color, and an overlay for the Lowest Low Value.
- The Lowest Low Value is plotted as a line that touches the lowest low values of the number of periods you set as your parameter.
Trading With Lowest Low Value
If price moves below or touches the Lowest Low Value indicator it could be an indication of a trend reversal. However, the indicator can continue to go lower in a stair-step pattern. Since the indicator has a lookback period of a specific number of days, it can be somewhat lagging.