
|
Table of Contents
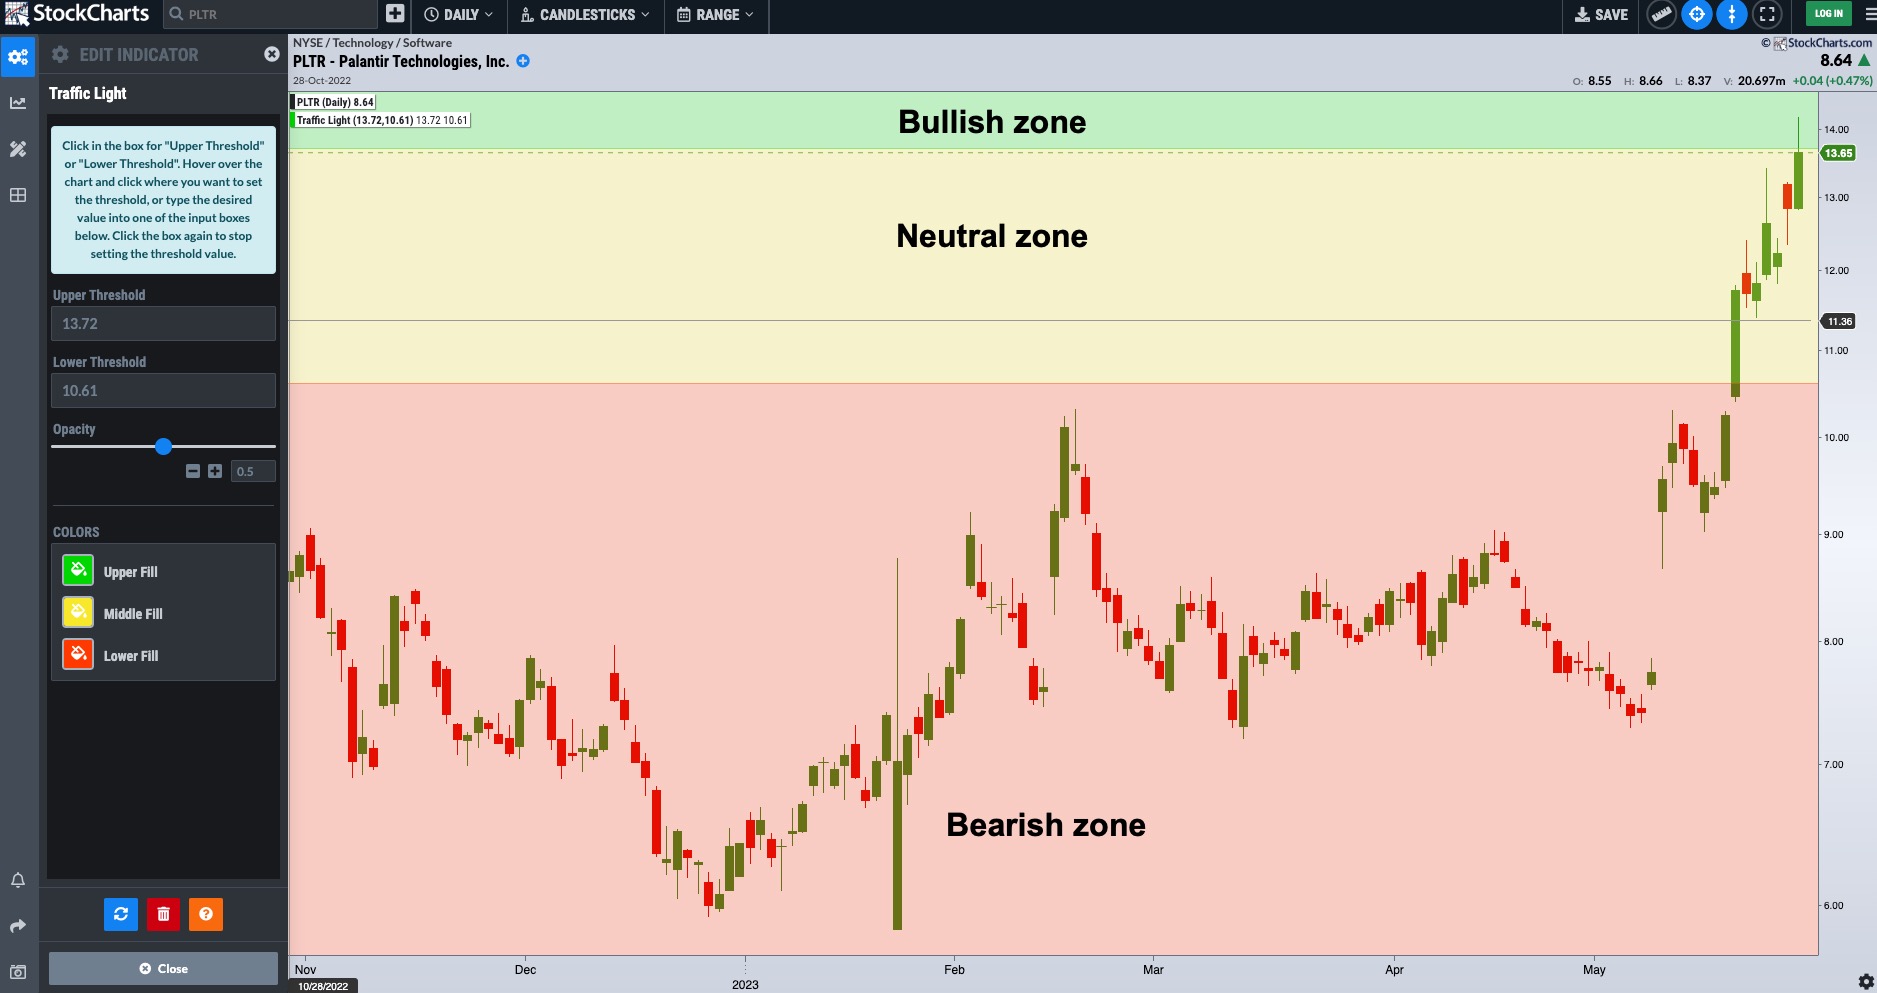
Traffic Light
Introduction: What Is the Traffic Light Indicator?
Green, yellow, and red—they're your standard traffic light colors. Green is for go, yellow for caution, and red for stop.
The Traffic Light indicator shades the chart green, yellow, and red based on an upper and/or lower level you set. The idea is to define bullish, bearish, and neutral “zones” on a chart. The green area indicates bullish conditions and that price will probably go higher. The red area indicates bearish conditions, which could mean that price will go lower. The yellow area indicates neutrality or indecision among bulls and bears.
Adding the Traffic Light Indicator to a Chart
- In the StockChartsACP platform, enter a symbol
- Scroll down to Traffic Light in the indicator list and click on it
- Set your upper and lower threshold levels
How do you set your threshold levels? There are a couple of different ways. You can do the following:
- Click on the “Upper Threshold” or “Lower Threshold” boxes. Then hover over the chart and click on where you want to set the threshold levels. Click the box again to stop setting the threshold level.
- Type in your desired value into the respective upper or lower threshold boxes
The bigger question is, how do you pick the threshold levels? They could be based on support and resistance levels, price gaps, pattern breakouts, or any trading strategy you wish to apply.