|
|
Table of Contents
Filtering MACD Zero-Line Crosses With Swing Points
KEY TAKEAWAYS
- The MACD zero line cross is a popular tool to gauge market momentum and generate trade signals.
- The accuracy of the zero line cross can be increased by paying attention to swing points—essentially, the basic building blocks of trends.
- While the zero line cross gives the initial signal, real-time price action can help guide your decisions by analyzing the larger context of the trade.
Catching a robust trend early on isn’t the easiest thing to do. You can often end up with false signals and failed starts. Perhaps that’s why trend traders are called trend followers and not trend forecasters. But there are tools that can help you identify that shift in momentum that just might evolve into that early trend you’re looking for.
One of the more popular tools is the Moving Average Convergence Divergence, aka MACD. The MACD indicator has various parts which lend themselves to multiple functions. One part is the MACD zero line cross.
The problem with the zero line cross is that it’s subject to producing as much noise as signal. So, you need to filter it to increase your chances of success. But that involves a process. So, let’s start from the beginning.
What Is the MACD Zero Line Cross?
It’s when the MACD and signal line crosses the zero line. There are two types of crosses.
- Positive (Bullish) Zero Line Cross. This occurs when the MACD and signal lines cross above the zero line. It generally indicates that the stock is seeing upward momentum.
- Negative (Bearish) Zero Line Cross. This occurs when the MACD and signal lines cross below the zero line. As you might guess, this generally indicates downward momentum.

The image above illustrates the two types of crosses. The zero line is the threshold. The concept is easy to follow, but when it comes to applying it to your trades, it takes a nuanced perspective to interpret the crossover.
How Can You Filter the Zero Line Cross to Increase Accuracy?
Since the MACD, based on moving averages, is already a lagging indicator, an effective way to get a more accurate read would be to use real-time price action. And since you’re trying to gauge a trend or its reversal, you could focus on swing points—swing highs and swing lows.
After all, these are the basic building blocks or trends:
- Uptrend = Higher highs (HH) and higher lows (HL)
- Downtrend = Lower lows (LL) and lower highs (LH)
For an uptrend to sustain itself, there must be continuous upward breakouts of previous swing highs while the lows must not break below previous swing lows. The reverse is true of downtrends.
In short, you can use swing points to increase the odds of success when trading MACD zero line crosses. Let’s look at an example of this method in action.
Combining MACD Zero Line Cross With Swing Points
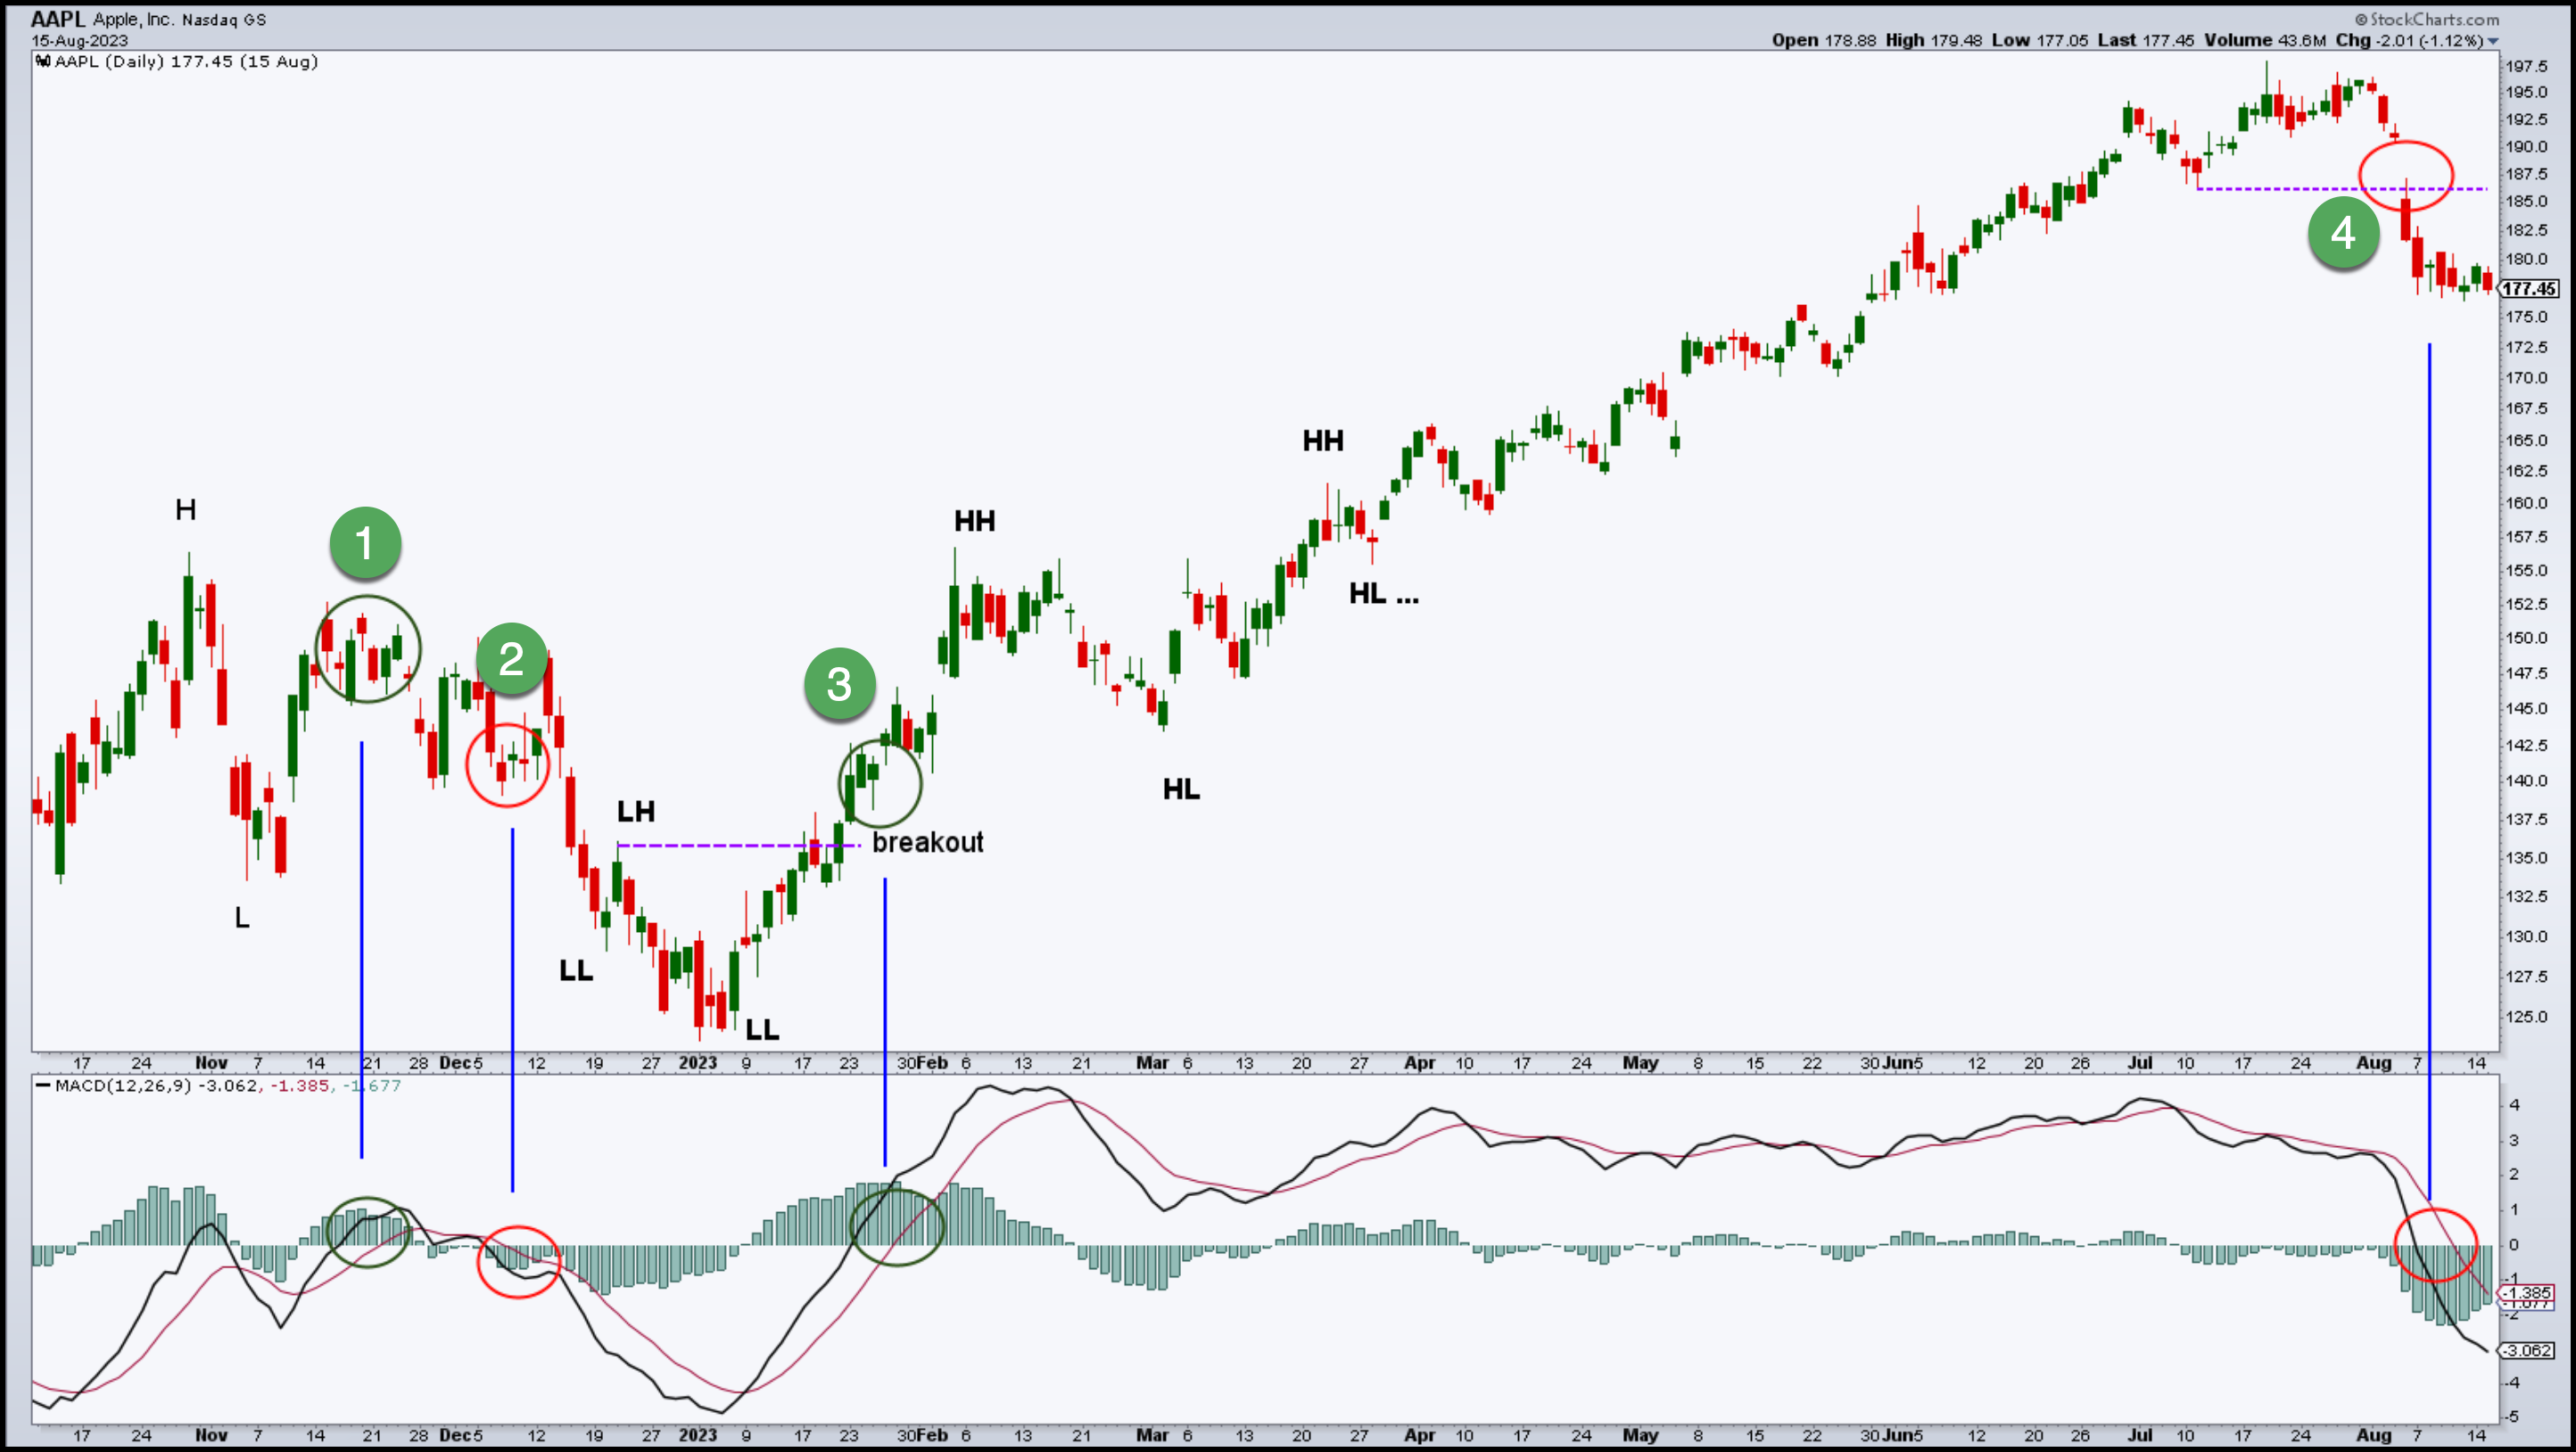
The chart below illustrates false and “ideal” signals.

Let’s walk through the chart.
The prominent H (high) and L (low) on the leftmost part of the chart define the swing point boundaries that price must break through to start an uptrend or downtrend.
1— The zero line cross accompanied by a positive cross took place within the H–L range—there’s no bullish indication based on where price is in relation to the swing points.
2— The second zero line cross, accompanied by a negative cross, shows a minor trend within the congestion range. Although the signal may indicate potential bearish action, it wasn’t the strongest signal, even though in hindsight, the outcome could have been positive. Remember, strong signals can sometimes produce bad outcomes and vice versa.
3— This zero-line cross tells a different story. Looking back at the previous lows, you’ll notice that price broke below the initial H–L range and initiated a downtrend (LL and LH). But then it appeared to bottom out at the second LL, eventually breaking above the most recent LH swing point. This indicates a potential upside reversal.
From then on, you can see how the rally continued until the next zero-line cross, where the trade would have been completed.
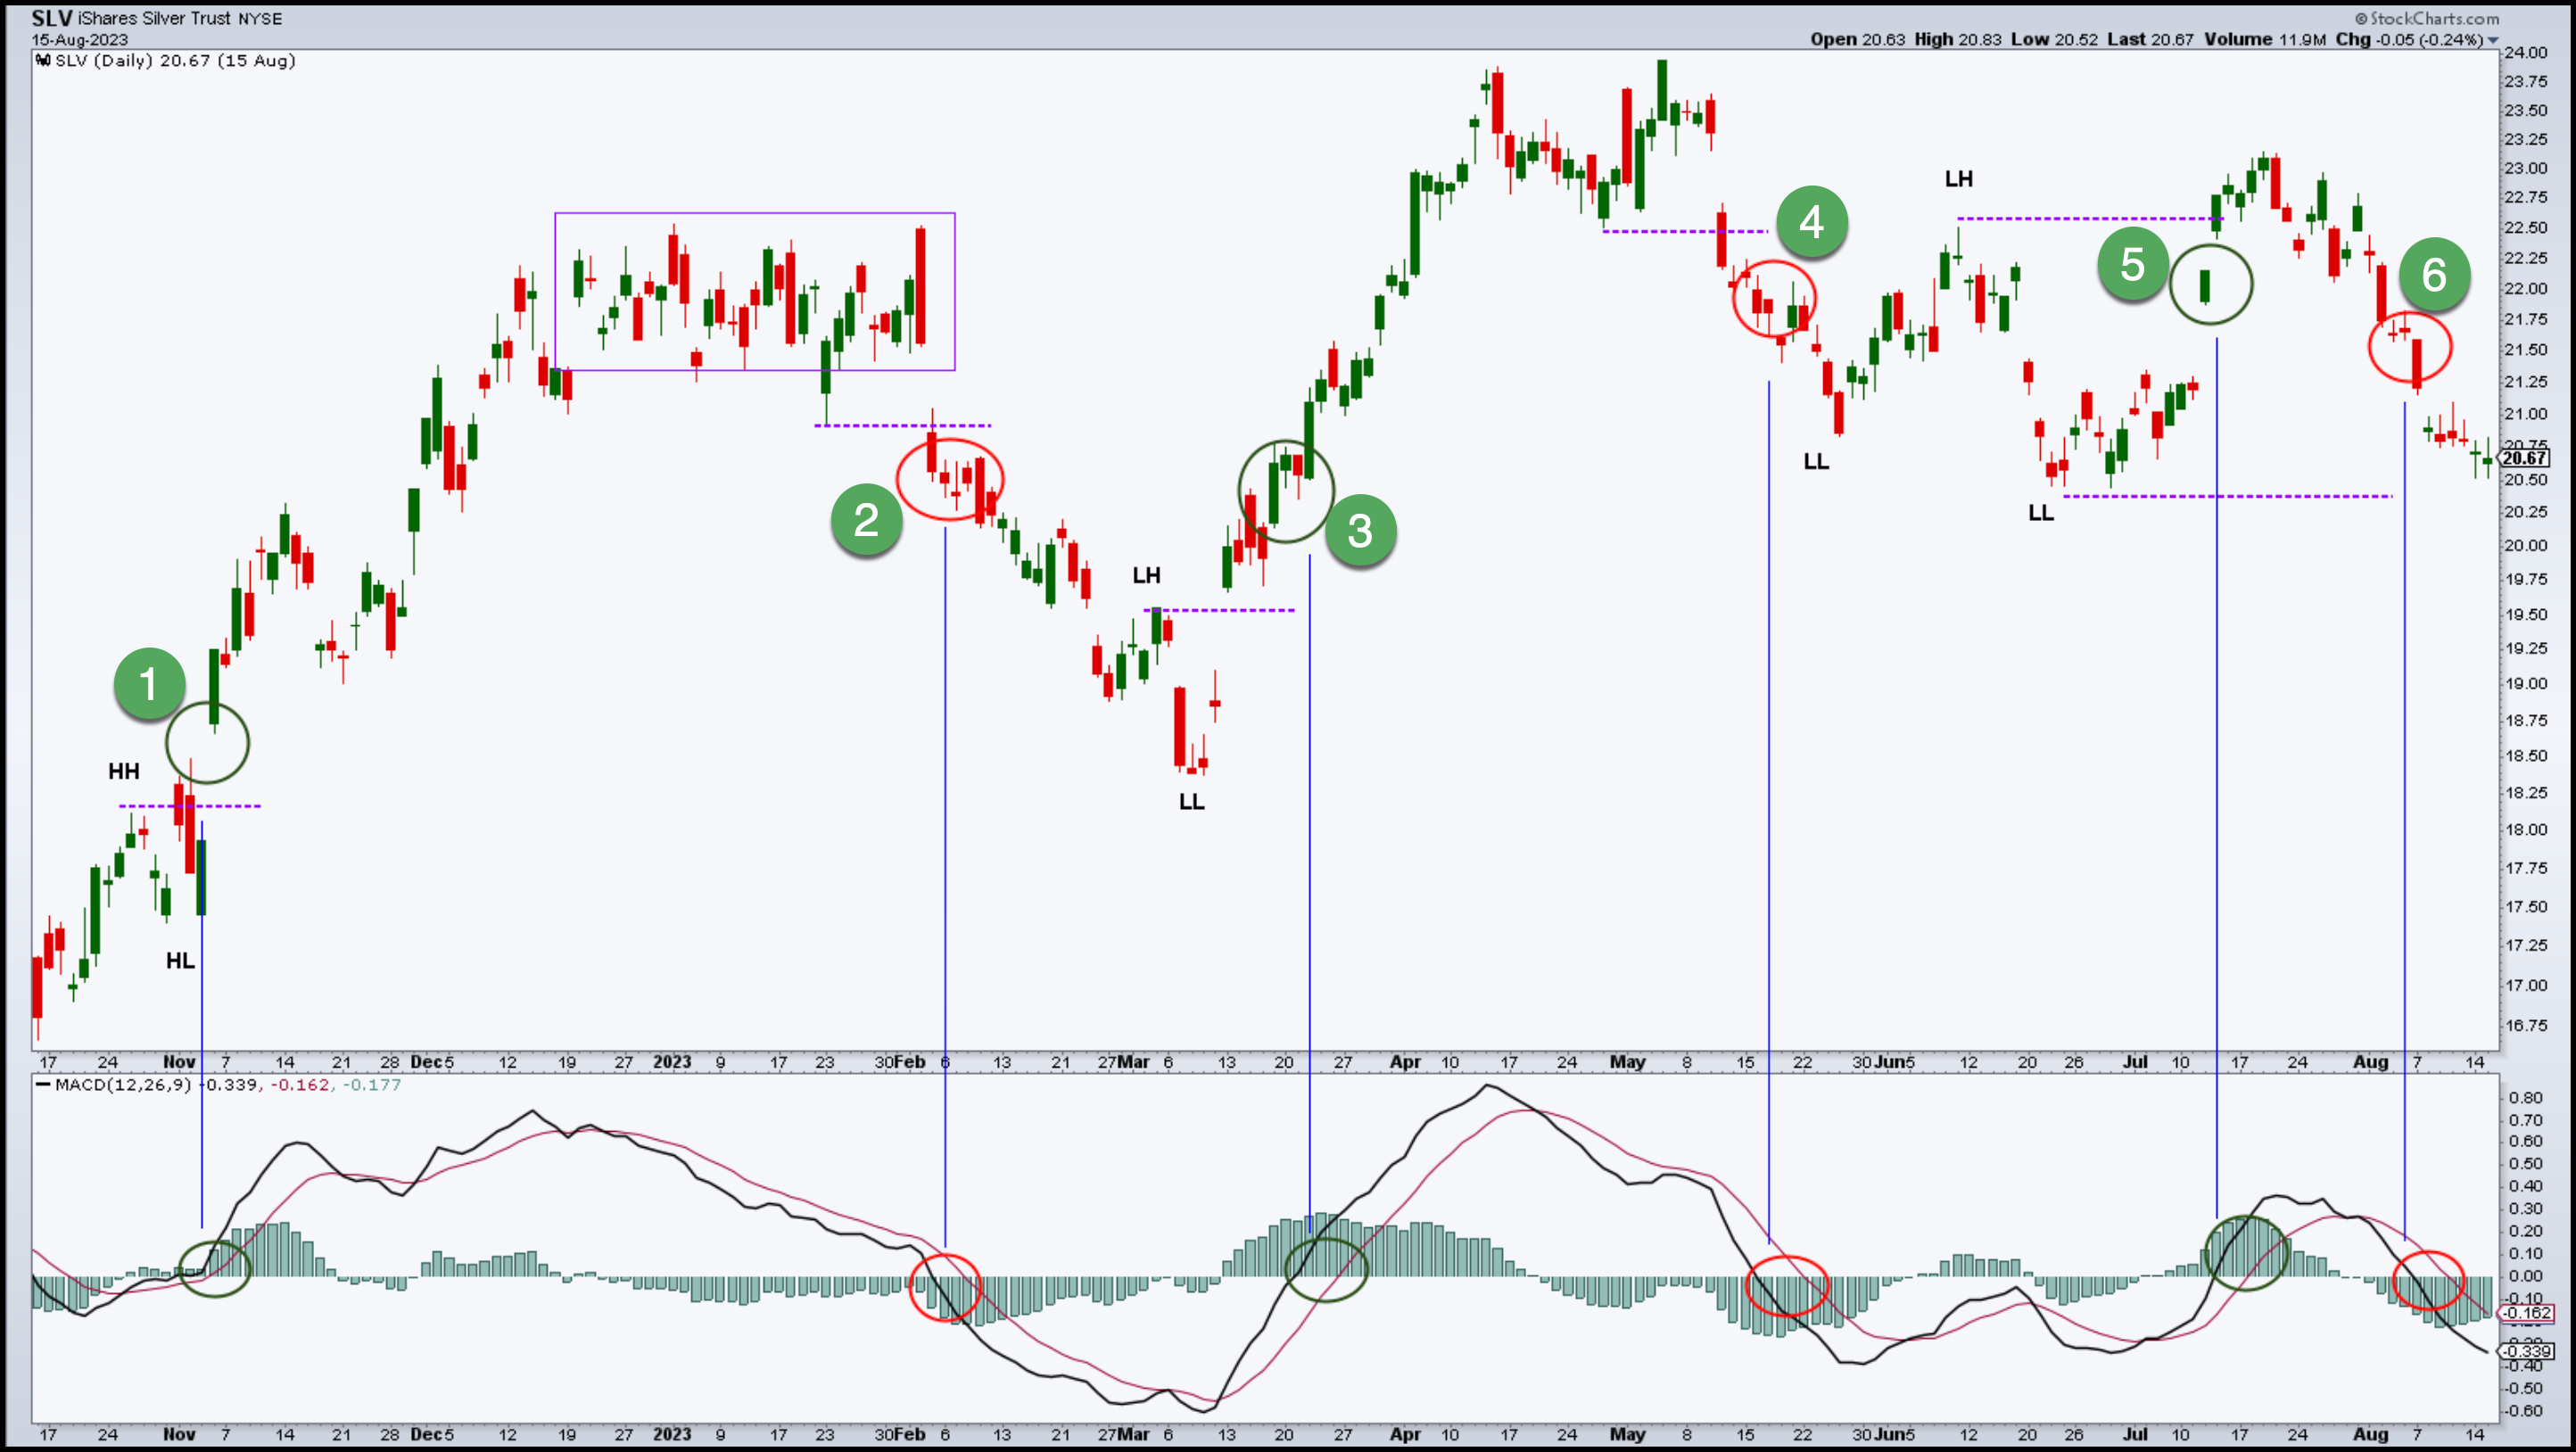
That was a straightforward example. But in some cases, the markets may prove much more difficult. Take the following chart of iShares Silver Trust ETF (SLV).
The SLV chart shows a couple of important caveats.
- Your trade exits can’t always rely on the opposite zero-line cross (doing so can erase your profits). It helps to have other methods for making your exit decisions.
- Some market conditions are more suitable to short-term swing trades than longer-term holds (that’s the case for SLV).

1— The favorability of the first zero line cross stems from the break above the HH. But if you held the position open until the negative cross, you would have seen a large portion of your profits erased. Did you notice the congestion at the top (purple rectangle)? You might have placed your stops to take your profit below the support area.
2— This would be a short trade. The break below the rectangle pattern would have made this a favorable setup. Again, holding the short position until the next (positive) cross would have been a mistake. Instead, you might have used a measured move, aiming for a 100% extension of the risk (height of the rectangle) instead.
3— As with the first trade, the same could have been said of this trade. It’s best to pay attention to areas of congestion and trail your stop a few points below each swing low. This would have preserved most of your profits.
4— If you waited until the cross to enter a short position, this trade would have resulted in a loss or a breakeven. There’s a break below the topping price action while the MACD and signal lines are clearly falling. This trigger supersedes the zero line cross as the odds of a negative cross were highly probable.
5 and 6— The zero line crosses took place between two defining areas of support and resistance (LL and LH). It means entering a trade would have “jumped the gun” on a breakout on either side. Sometimes, if you’re lucky, this might work out. But in this case, it didn’t. This is why you might wait for a breakout or any other bullish or bearish driver before you enter a trade during a zero-line cross.
In short, the rules for trading a zero-line cross are pretty simple: wait for a zero-line cross and check the swing points or any other price action that supports the bullish or bearish case for a trade. Otherwise, you simply rely on the zero line cross, making you vulnerable to false signals.
The Bottom Line
Catching an early trend or trend change is a challenging endeavor, often mired by false signals. However, tools like the MACD can help you identify potential momentum shifts. Specifically, the MACD zero line cross, which has bullish or bearish implications based on its direction, can be a useful tool. However, it's important to filter this signal to avoid market noise. By combining the MACD zero line cross with swing points, meaning real-time price action, you can enhance your odds of success. In the end, while the zero line cross provides a hint, it's the underlying price action that more accurately determines the market opportunity.
