Table of Contents
Point & Figure Charting
P&F Basics
- Introduction to Point & Figure Charts - This article shows how to construct P&F charts with a step-by-step example. Users will learn how to identify support and resistance as well as how to draw P&F trend lines.
- P&F Scaling and Timeframes - This in-depth article explores how to use different price intervals to choose a charting timeframe. Intraday intervals can be used for medium-term timeframes, while daily intervals are often best for long-term charts.
- P&F Trend Lines - P&F trend lines are unique because they are drawn at a specific angle to represent a certain rate of ascent or descent. This article shows how automatic trend lines appear, when they reverse and how to identify a break.
Classic Patterns
With well over a dozen P&F patterns, there is often an active or developing pattern on a P&F chart. Identifying these patterns and the confirming breakout form an essential part of the P&F analysis process.
- Bullish Breakout Patterns - Double Top Breakout, Triple Top Breakout, Spread Triple Top Breakout and Quadruple Top Breakout are covered in this group.
- Bearish Breakdown Patterns - Double Bottom Breakdown, Triple Bottom Breakdown, Spread Triple Bottom Breakdown and Quadruple Bottom Breakdown are covered in this group.
- Bearish and Bullish Signal Reversed - These patterns resemble a rising flag or falling flag on a classic bar chart.
- Bullish and Bearish Catapults - Many P&F aficionados consider catapult signals to be the strongest. Catapults mark a classic breakout, a mild correction, and a continuation breakout.
- Bullish and Bearish Triangles - These patterns resemble triangles in bar charts, but a basic P&F signal is required for confirmation.
- Bull and Bear Traps - These patterns are exactly what they sound like. A bear trap suckers the sellers before rallying, while a bull trap suckers the buyers before declining.
Price Objectives
Price Objectives can be formulated from classic P&F patterns and basic price movements. Chartists can also compute their own Price Objectives using the Vertical Count Method or the Horizontal Count Method.
- Breakout & Reversal Method - This article details the methodology for Price Objectives based on the Breakout Method and the Reversal Method.
- Horizontal Count Method - The width of the P&F pattern is often central to its potency. The wider the pattern, the more important the break. This article shows how to compute a Price Objective using that width.
- Vertical Count Method - Sometimes strength begets strength as a strong move (long column) can signal the start of an extended move. In this case, chartists can use the column height to obtain a Price Objective.
P&F Indicators
Chartists can apply trend lines, moving averages, Bollinger Bands and Volume-by-Price to P&F charts at StockCharts.com. While the basic formulas and principles remain the same, P&F indicators are unique and different from their bar chart cousins.
Learn More: P&F Indicators
Scans and Alerts
P&F Pattern Alerts can be found at end of the Predefined Scans Page. These are based on daily data. StockCharts.com provides daily alerts for more than 15 P&F patterns on various exchanges.
Learn More: P&F Pattern Alerts
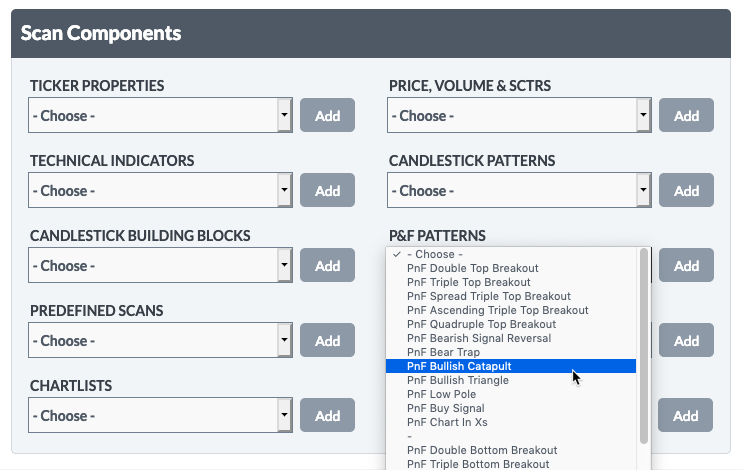
Chartists can also scan for specific P&F patterns using daily data and the drop-down menu for P&F Patterns on the Advanced Scan Workbench. Over 20 P&F patterns and criteria are included in this drop-down menu. Users can combine these P&F patterns with other non-P&F criteria to create truly unique scans.
