|
|
Table of Contents
Using the 5-8-13 EMA Crossover for Short-Term Trades
Short-term trading is a fast-paced activity that isn’t suitable for every trader. Among its unique challenges is the importance of maintaining a balance between acting quickly on market opportunities and not acting too hastily. From a trading psychology angle, this isn’t easy, and not every trader has the right mindset to walk this tightrope.
But if you're willing to give it a try, there are a few indicators, methods, and strategies that can help you respond quickly to the markets while filtering out noisy data that can lead to making rash decisions. Among them, the 5-8-13 Exponential Moving Average (EMA) combination is a favorite for many short-term traders.
Why the 5-8-13 EMA Crossover?
Let’s break this down into three questions:
Why the Exponential Moving Average?
Unlike the simple moving average (SMA), which calculates an average of price data on an equal basis, the EMA gives more weight to the most recent prices. This makes the EMA more reactive to recent price changes. And this increased sensitivity makes it ideal for short-term traders who need to take a more rapid approach to price action.
Why a ‘Triple’ Exponential Moving Average (TEMA)?
The Triple Exponential Moving Average (TEMA) can be more responsive than a single EMA or a double EMA combination (DEMA), making it more suitable for short-term trading. TEMA's triple-smoothed approach allows it to align more closely with real-time price bars, providing earlier trading signals while helping filter out market noise which can lead to false signals.
Despite this, however, its rapid responsiveness can nevertheless lead to false signals in volatile markets, so it's important to use TEMA alongside other technical indicators to ensure more accurate trend readings.
Why the numbers 5-8-13?
The 5, 8, and 13 periods are Fibonacci numbers, which have historical, if not symbolic, significance in the financial markets due to their ubiquity in natural phenomena. While there's no scientific evidence that the Fibonacci sequence can predict price behavior, many traders use Fibonacci to identify potential support and resistance levels. This can often sometimes make Fibonacci numbers a self-fulfilling prophecy and hence predictable.
How Does the 5-8-13 EMA Crossover Work?
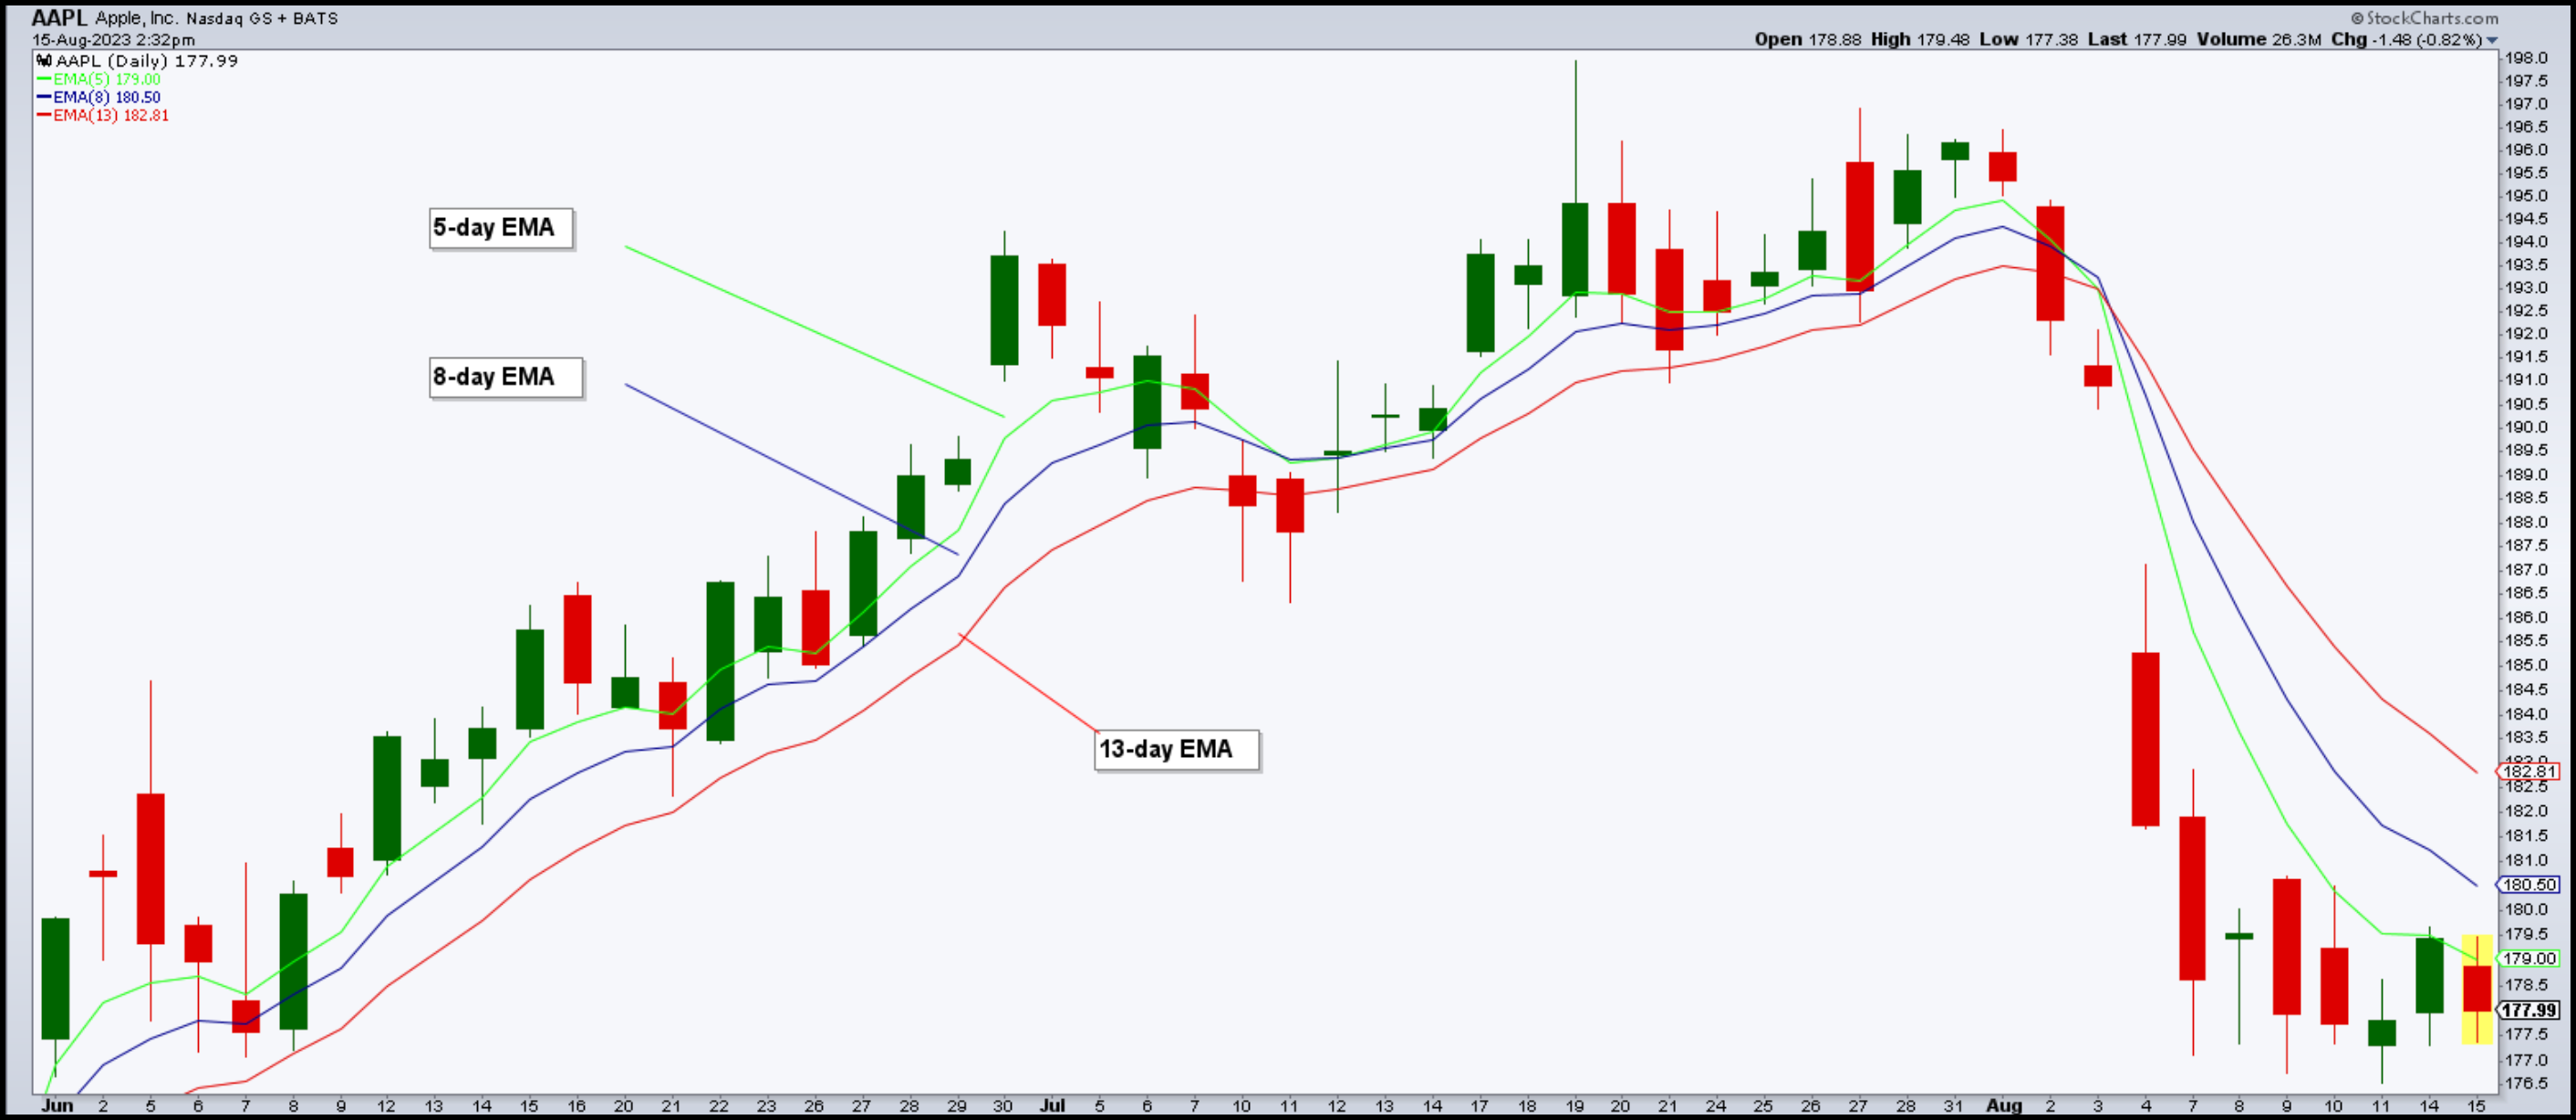
The crossover detects momentum shifts, which can hint at significant price moves in the near term.
- The 5-day EMA is the shortest-term EMA and is considered to be the most sensitive to price changes
- The 8-day EMA is a medium-term EMA
- The 13-day EMA is the longest-term EMA

When the 5-EMA crosses above the 8 and 13 EMAs, it suggests a rising bullish momentum. When the opposite happens, it indicates bearish momentum. You can use the 8-EMA and 13-EMA as filters.
When the crossover involves all three EMAs, the signal can be more robust than just a 5-8 or 5-13 crossover. Using all three can also significantly reduce market noise, helping you focus on the current trend (or shifts in trend).
How to Trade the 5-8-13 EMA
1–Setup. Plot the 5-period EMA, the 8-period EMA, and the 13-period EMA on your trading chart. From the Overlays section, do the following:
- Select Exp. Moving Avg and type 5 in the parameter field.
- Select Exp. Moving Avg for the next overlay and type 8 in the parameter field.
- Then add the info for the 13-period EMA.
2–Entry Signals.
- Bullish Signal. When the 5 EMA crosses above the 8 EMA, and both are above the 13 EMA, you can take this as a potential bullish signal. Consider the 5 EMA as the trigger, the 8 EMA as the intermediate measure, and the 13 EMA as the baseline. The crossover suggests the momentum is in favor of buyers.
- Bearish Signal. Conversely, you're looking at a bearish setup when the 5 EMA crosses below the 8 EMA and both are below the 13 EMA. Sellers are gaining the upper hand, and the opportunity to go short might be present.
3–Confirmations. Always use other technical indicators to confirm the signals. For instance, the Relative Strength Index (RSI) or the Stochastic Oscillator can help you confirm overbought or oversold conditions. You might also look at the Chaikin Money Flow indicator as a measure of buying or selling pressure to support your RSI or stochastic reading.
4–Set Profit Target and Stop Loss. One way to exit the trade is to wait for the 5 EMA to cross the 8 EMA in the opposite direction of the original trade. Otherwise, you can set profit targets using overhead resistance or any other measures according to your strategy.
Don’t forget to set your stop loss. You can place your stop loss below the most recent swing low and continue to trail your stop at the subsequent swing lows as prices move upward.
The reverse is true for a short trade—setting profit targets at support and stop losses at swing highs.
Example of 5-8-13 EMA Crossover

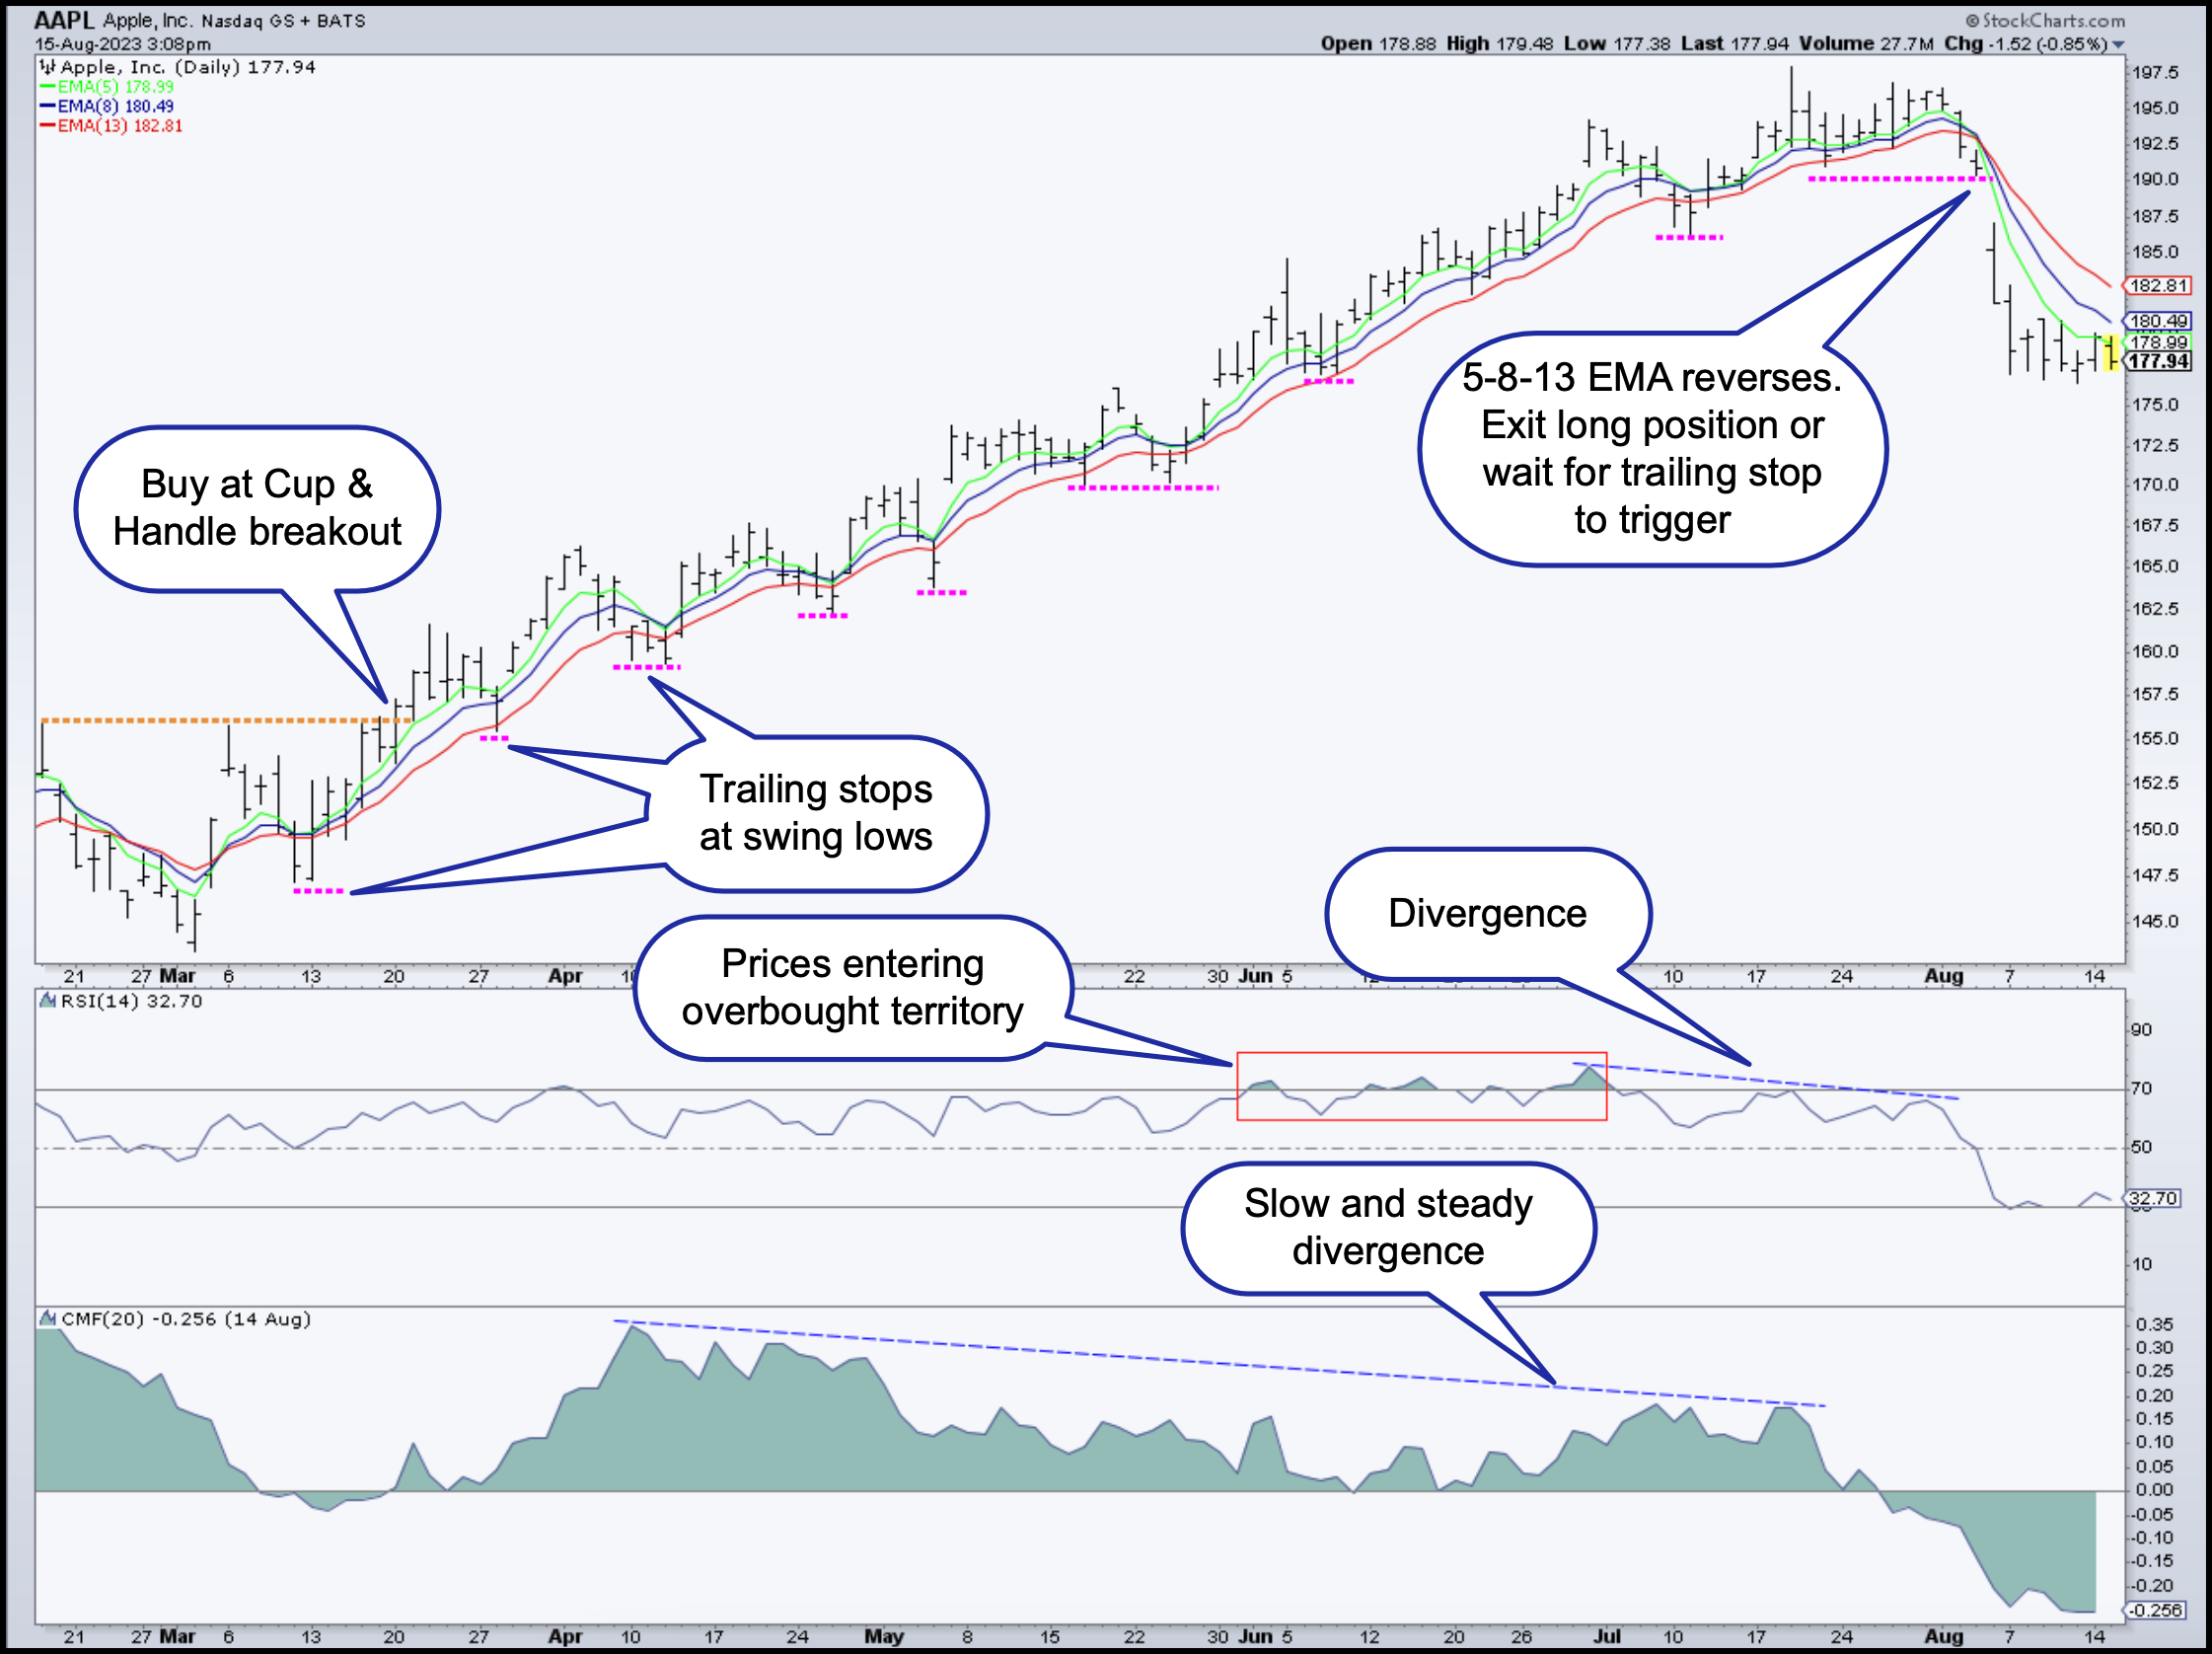
On the left side of the chart, you see the 5-8-13 EMA in early March. Although many potential methods exist to enter a long trade, one identified in the chart above was a Cup & Handle pattern. The breakout constitutes our hypothetical entry point.
The RSI and CMF gave favorable readings, confirming the bullish momentum. While the 5-8-13 EMA remained in “full-sail” mode, we trailed the stops (pink dashed lines) at each swing low point, catching nearly the entire uptrend.
As prices rose, there was a slow divergence in buying pressure on the CMF (blue dashed line). Toward the end of this upswing, the RSI gave three overbought readings (red rectangle) before signaling a divergence (blue dashed line). The end of the trade (hypothetical trade exit) could have been completed in one of three ways: the 5 EMA fell below the 8-day and 13-day EMA, the entire 5-8-13 TEMA combination reversed and turned negative, or price took out the trailing stop loss at the last swing low.
The Bottom Line
The 5-8-13 EMA combination has gained traction among traders as a tool for short-term market opportunities. However, while this combination might offer you something of an edge, approach it cautiously. No single technique, including the 5-8-13 EMA, offers a guaranteed formula for trading success. Its usage can sometimes produce false signals, especially in turbulent market conditions. So, complement this strategy with other technical indicators and always maintain a balanced risk management approach. Remember, while such tools provide a lens into promising market opportunities, they aren't definitive predictors of market behavior.
The Bottom Line
The 5-8-13 Exponential Moving Average (EMA) combination has gained traction among traders as a tool for short-term market opportunities. However, while this combination might offer you something of an edge, approach it with caution. No single technique, including the 5-8-13 EMA, offers a guaranteed formula for trading success. Its usage can sometimes produce false signals, especially in turbulent market conditions. So, be sure to complement this strategy with other technical indicators and always maintain a balanced risk management approach. Remember, while such tools provide a lens into promising market opportunities, they aren't definitive predictors of market behavior.
