
|
Table of Contents
Moving Averages - Simple and Exponential
What Is a Moving Average?
A moving average is an average of data points (usually price) for a specific time period. Why is it called “moving”? That's because each data point is calculated using data from the previous X periods. Because it averages prior data, moving averages smooth the price data to form a trend-following indicator.
A moving average doesn't predict price direction. Instead, it defines the current direction. However, a moving average tends to lag because it's based on past prices. Despite this, investors use moving averages to help smooth price action and filter out the noise.
What is the Best Way to Use Moving Averages?
Moving averages can be used to identify trend direction or define potential support and resistance levels. They also form the building blocks for many other technical indicators and overlays, such as Bollinger Bands, MACD and the McClellan Oscillator.

Click here for a live version of the chart.
The two most popular moving averages are the simple moving average (SMA) and the exponential moving average (EMA). Simple moving averages (SMAs) average prices over the specified timeframe, while exponential moving averages (EMAs) give more weight to recent prices. Other specialty moving averages available in our charting tools include DEMA, Hull Moving Average, KAMA, and TEMA.
Learn More: DEMA | Hull Moving Average | KAMA | TEMA
What is the Lag Factor in Moving Averages?
Because moving averages are based on past data, they tend to lag behind price data. The longer the moving average, the more the lag. In addition, the type of moving average affects the lag: EMAs with the more recent data weighted more heavily will lag less than an SMA, which gives equal weight to data further in the past.
A 10-day moving average will hug prices quite closely and turn shortly after prices turn. Short-term moving averages are like speedboats—nimble and quick to change. In contrast, a 100-day moving average contains lots of past data that slows it down. Longer-term moving averages are like ocean tankers—lethargic and slow to change. It takes a larger and longer price movement for a 100-day moving average to change course vs. a 10-day moving average.

Click here for a live version of the chart.
The chart above shows the SPDR S&P 500 ETF (SPY) with a 10-day EMA closely following prices and a 100-day SMA grinding higher. Even with the January-February decline, the 100-day SMA held the course and did not turn down. The 50-day SMA fits somewhere between the 10- and 100-day moving averages when it comes to the lag factor.
Keep the lag factor in mind when choosing the right moving average for your chart. Your moving average preferences will depend on your objectives, analytical style, and time horizon. Try experimenting with both types of moving averages, different timeframes, and different securities to find the best fit.
How Do You Calculate Moving Averages?
All moving averages take the average of a specified number of prior data points, but each type of moving average weights those data points differently.
Simple Moving Average Formulas
A simple moving average is formed by computing the average price of a security over a specific number of periods. Most moving averages are based on closing prices; for example, a 5-day simple moving average is the five-day sum of closing prices divided by five. As its name implies, a moving average is an average that moves. Old data is dropped as new data becomes available, causing the average to move along the time scale. The example below shows a 5-day moving average evolving over three days.
Daily Closing Prices: 11,12,13,14,15,16,17

First day of 5-day SMA: (11 + 12 + 13 + 14 + 15) / 5 = 13

Second day of 5-day SMA: (12 + 13 + 14 + 15 + 16) / 5 = 14

Third day of 5-day SMA: (13 + 14 + 15 + 16 + 17) / 5 = 15
The first day of the moving average simply covers the last five days. The second day of the moving average drops the first data point (11) and adds the new data point (16). The third day of the moving average continues by dropping the first data point (12) and adding the new data point (17). In the example above, prices gradually increase from 11 to 17 over a total of seven days. Notice that the moving average also rises from 13 to 15 over a three-day calculation period. Also, notice that each moving average value is just below the last price. For example, the moving average for day one equals 13 and the last price is 15. Prices the prior four days were lower and this causes the moving average to lag.
Exponential Moving Average Formulas
Exponential moving averages (EMAs) reduce the lag by applying more weight to recent prices. The weighting applied to the most recent price depends on the number of periods in the moving average. EMAs differ from simple moving averages in that a given day's EMA calculation depends on the EMA calculations for all the days prior to that day. You need far more than 10 days of data to calculate a reasonably accurate 10-day EMA.
There are three steps to calculating an exponential moving average (EMA). First, calculate the simple moving average for the initial EMA value. An exponential moving average (EMA) has to start somewhere, so a simple moving average is used as the previous period's EMA in the first calculation. Second, calculate the weighting multiplier. Third, calculate the exponential moving average for each day between the initial EMA value and today, using the price, the multiplier, and the previous period's EMA value. The formula below is for a 10-day EMA.
Initial SMA: 10-period sum / 10

Multiplier: (2 / (Time periods + 1) ) = (2 / (10 + 1) ) = 0.1818 (18.18%)

EMA: {Close - EMA(previous day)} x multiplier + EMA(previous day).
What is the Weighting Multiplier in a Moving Average?
A 10-period exponential moving average applies an 18.18% weighting to the most recent price. A 10-period EMA can also be called an 18.18% EMA. A 20-period EMA applies a 9.52% weighting to the most recent price (2/(20+1) = .0952). Notice that the weighting for the shorter time period is more than the weighting for the longer time period. In fact, the weighting drops by half every time the moving average period doubles.
If you want to use a specific percentage for an EMA, you can use this formula to convert it to time periods and then enter that value as the EMA's parameter:
Time Period = (2 / Percentage) - 1

3% Example:  Time Period = (2 / 0.03) - 1 = 65.67 time periods
How Accurate is the EMA?
Below is a spreadsheet example of a 10-day simple moving average and a 10-day exponential moving average for Intel. The SMA calculation is straightforward and requires little explanation: the 10-day SMA simply moves as new prices become available and old prices drop off. The exponential moving average in the spreadsheet starts with the SMA value (22.22) for its first EMA value. After the first calculation, the normal EMA formula is used.
The formula for an EMA incorporates the previous period's EMA value, which in turn incorporates the value for the EMA value before that, and so on. Each previous EMA value accounts for a small portion of the current value. Therefore, the current EMA value will change depending on how much past data you use in your EMA calculation. Ideally, for a 100% accurate EMA, you should use every data point the stock has ever had in calculating the EMA, starting your calculations from the first day the stock existed. This is not always practical, but the more data points you use, the more accurate your EMA will be. The goal is to maximize accuracy while minimizing calculation time.
The spreadsheet example below goes back 30 periods. With only 30 data points incorporated in the EMA calculations, the 10-day EMA values in the spreadsheet are not very accurate. On our charts, we calculate back at least 250 periods (typically much further), resulting in EMA values that are accurate to within a fraction of a penny.

Adjusting the Settings
Simple vs Exponential Moving Averages
When adding a moving average to your chart, the first choice to make is whether to use an exponential or a simple moving average. Even though there are clear differences between simple moving averages and exponential moving averages, one is not necessarily better than the other. Choosing the right type of moving average depends on your trading objectives.
Exponential moving averages have less lag and are therefore more sensitive to recent prices - and recent price changes. Exponential moving averages will turn before simple moving averages.
Simple moving averages, on the other hand, represent a true average of prices for the entire time period. As such, simple moving averages may be better suited to identify support or resistance levels.
The chart below shows IBM with the 50-day SMA in red and the 50-day EMA in green. Both peaked in late January, but the decline in the EMA was sharper than the decline in the SMA. The EMA turned up in mid-February, but the SMA continued lower until the end of March. Notice that the SMA turned up over a month after the EMA.

Lengths and Timeframes
The length of the moving average depends on the trader's time horizon and analytical objectives. Short moving averages (5-20 periods) are best suited for short-term trends and trading. Chartists interested in medium-term trends would opt for longer moving averages that might extend 20-60 periods. Long-term investors will prefer moving averages with 100 or more periods.
Some moving average lengths are more popular than others. The 200-day moving average is perhaps the most popular. Because of its length, this is clearly a long-term moving average. Next, the 50-day moving average is quite popular for the medium-term trend. Many chartists use the 50-day and 200-day moving averages together. Short-term, a 10-day moving average was quite popular in the past because it was easy to calculate. One simply added the numbers and moved the decimal point.
Base Data
Moving averages are typically based on price data, and specifically closing price data. However, this indicator can be applied to other types of price data (open, high, or low), volume data, or even other indicators. The example below shows a chart with a 50-day SMA applied to the volume bars, and a 20-day EMA applied to the RSI indicator.
 indicator")
Interpreting Moving Averages
Moving averages can be used to identify the trend, as well as support and resistance levels. Crossovers with price or with another moving average can provide trading signals. Chartists may also create a Moving Average Ribbon with more than one moving average to analyze the interaction between multiple MAs at once.
How Do You Identify a Trend Using Moving Averages?
The direction of the moving average conveys important information about prices, whether that average is simple or exponential. A rising moving average shows that prices are generally increasing. A falling moving average indicates that prices, on average, are falling. A rising long-term moving average reflects a long-term uptrend. A falling long-term moving average reflects a long-term downtrend.
The chart below shows 3M (MMM) with a 150-day exponential moving average. This example shows how well moving averages work when the trend is strong.

The 150-day EMA turned lower in November 2007 and again in January 2008. Notice that it took a 15% decline to reverse the direction of this moving average. These lagging indicators identify trend reversals as they occur (at best) or after they occur (at worst). MMM continued lower into March 2009 and then surged 40-50%. Notice that the 150-day EMA did not turn up until after this surge. Once it did, however, MMM continued higher the next 12 months. Moving averages work brilliantly in strong trends.
How Do You Read a Double Moving Average Crossover?
Two moving averages can be used together to generate crossover signals. In Technical Analysis of the Financial Markets, John Murphy calls this the “double crossover method”. Double crossovers involve one relatively short moving average and one relatively long moving average. As with all moving averages, the general length of the moving average defines the timeframe for the system. A system using a 5-day EMA and a 35-day EMA would be deemed short-term. A system using a 50-day SMA and 200-day SMA would be deemed medium-term, perhaps even long-term.
A bullish crossover occurs when the shorter moving average crosses above the longer moving average. This is also known as a golden cross. A bearish crossover occurs when the shorter moving average crosses below the longer moving average. This is known as a death cross (sometimes called a “dead cross”).
Moving average crossovers produce relatively late signals. After all, the system employs two lagging indicators. The longer the moving average periods, the greater the lag in the signals. These signals work great when a good trend takes hold. However, when there's no strong trend, a moving average crossover system will produce many whipsaws.
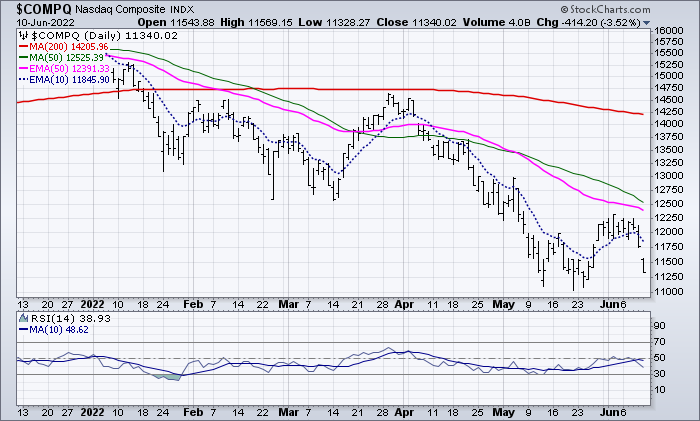
There is also a triple crossover method that involves three moving averages. Again, a signal is generated when the shortest moving average crosses the two longer moving averages. A simple triple crossover system might involve 5-day, 10-day, and 20-day moving averages.
The chart below shows Home Depot (HD) with a 10-day EMA (green dotted line) and 50-day EMA (red line). The black line is the daily close.

A moving average crossover would have resulted in three whipsaws before catching a good trade. The 10-day EMA broke below the 50-day EMA in late October (1), but this did not last long as the 10-day moved back above in mid-November (2). This cross lasted longer, but the next bearish crossover in January (3) occurred near late November price levels, resulting in another whipsaw. This bearish cross did not last long, as the 10-day EMA moved back above the 50-day a few days later (4). After three bad signals, the fourth signal foreshadowed a strong move as the stock advanced over 20%.
The takeaways:
- Crossovers are prone to whipsaw. You can prevent whipsaws by applying a price or time filter. Traders might require the crossover to last three days before acting or the 10-day EMA to move above/below the 50-day EMA by a certain amount before acting.
- MACD can be used to identify and quantify these crossovers. MACD (10,50,1) will show a line representing the difference between the two exponential moving averages. MACD turns positive during a golden cross and negative during a death cross. The Percentage Price Oscillator (PPO) can be used similarly to show percentage differences. Note that MACD and the PPO are based on exponential moving averages and will not match up with simple moving averages.
The chart below shows Oracle (ORCL) with the 50-day EMA, 200-day EMA, and MACD(50,200,1).

There were four moving average crossovers over a two-and-a-half-year period. The first three resulted in whipsaws or bad trades. A sustained trend began with the fourth crossover as ORCL advanced to the mid-20s. Once again, moving average crossovers work great when the trend is strong but when there's no strong trend, they can result in whipsaws.
How Do You Interpret Price Crossing a Moving Average?
Moving averages can also be used to generate signals with simple price crossovers. A bullish signal is generated when prices move above the moving average. A bearish signal is generated when prices move below the moving average. Price crossovers can be combined to trade within the bigger trend. The longer moving average sets the tone for the bigger trend, and the shorter moving average generates the signals. You would look for bullish price crosses only when prices are already above the longer moving average. This would be trading in harmony with the bigger trend. For example, if price is above the 200-day moving average, chartists would only focus on signals when price moves above the 50-day moving average. A move below the 50-day moving average would precede such a signal, but such bearish crosses would be ignored because the bigger trend is up. A bearish cross would simply suggest a pullback within a bigger uptrend. A cross back above the 50-day moving average would signal an upturn in prices and a continuation of the bigger uptrend.
The next chart shows Emerson Electric (EMR) with the 50-day EMA and 200-day EMA. The stock crossed and held above the 200-day moving average in August. There were dips below the 50-day EMA in early November and again in early February. Prices quickly moved back above the 50-day EMA to provide bullish signals (green arrows) in harmony with the bigger uptrend. MACD(1,50,1) is shown in the indicator window to confirm price crosses above or below the 50-day EMA. The 1-day EMA equals the closing price. MACD(1,50,1) is positive when the close is above the 50-day EMA and negative when the close is below the 50-day EMA.

Learn More About Moving Average Crossovers» How To Trade Price-to-Moving Average Crossovers
Can Moving Averages Be Used To Identify Support and Resistance?
Moving averages can also act as support in an uptrend and resistance in a downtrend. A short-term uptrend might find support near the 20-day simple moving average, also used in Bollinger Bands. A long-term uptrend might find support near the 200-day simple moving average, the most popular long-term moving average. The 200-day moving average may offer support or resistance because it's widely used. It is almost like a self-fulfilling prophecy.

The chart above shows the NY Composite with the 200-day simple moving average from mid-2004 until the end of 2008. The 200-day provided support numerous times during the advance. Once the trend reversed with a double top support break, the 200-day moving average acted as resistance around 9500.
Do not expect exact support and resistance levels from moving averages, especially longer moving averages. Markets are driven by emotion, which makes them prone to overshoots. Instead of exact levels, moving averages can be used to identify support or resistance zones.
Learn More: Support and Resistance; How to trade using moving averages as support and resistance levels
How Do You Read a Moving Average Ribbon?
Several moving averages of different lengths can be plotted on the same chart. The moving average lines resemble a ribbon moving across the chart:
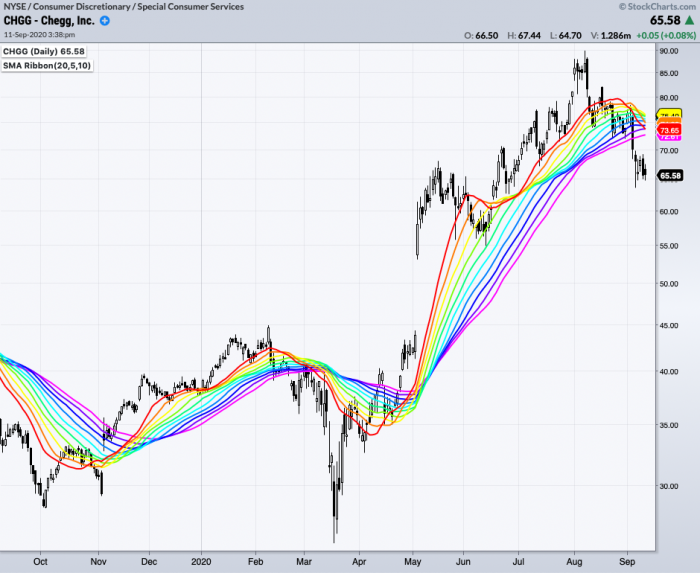
In addition to analyzing individual moving average lines on the ribbon, you can glean information from the ribbon itself. If the lines are running in parallel, this indicates a strong trend. If the ribbon is expanding (the lines are moving further apart over time), the trend is ending. If the ribbon is contracting (the lines are moving closer together or even crossing), this can indicate the start of a new trend.
Learn More: Moving Average Ribbon
The Bottom Line
The advantages of using moving averages need to be weighed against the disadvantages. Moving averages are trend-following, or lagging, indicators that will always be a step behind. This isn't necessarily a bad thing, though. After all, the trend is your friend, and it's best to trade in the direction of the trend. Moving averages ensure that a trader is in line with the current trend. Even though the trend is your friend, securities spend much time in trading ranges, which renders moving averages ineffective. Once in a trend, moving averages will keep you in but also give late signals. Don't expect to sell at the top and buy at the bottom using moving averages.
As with most technical analysis tools, moving averages should not be used alone, but in conjunction with other complementary tools. For example, chartists can use moving averages to define the overall trend and then use RSI to define overbought or oversold levels.
Charting with Moving Averages
The Moving Average overlays (both Simple and Exponential) can be added to SharpCharts and ACP Charts. The Simple Moving Average overlay can also be added to P&F Charts.
Using with SharpCharts
Click here for a live version of this chart.
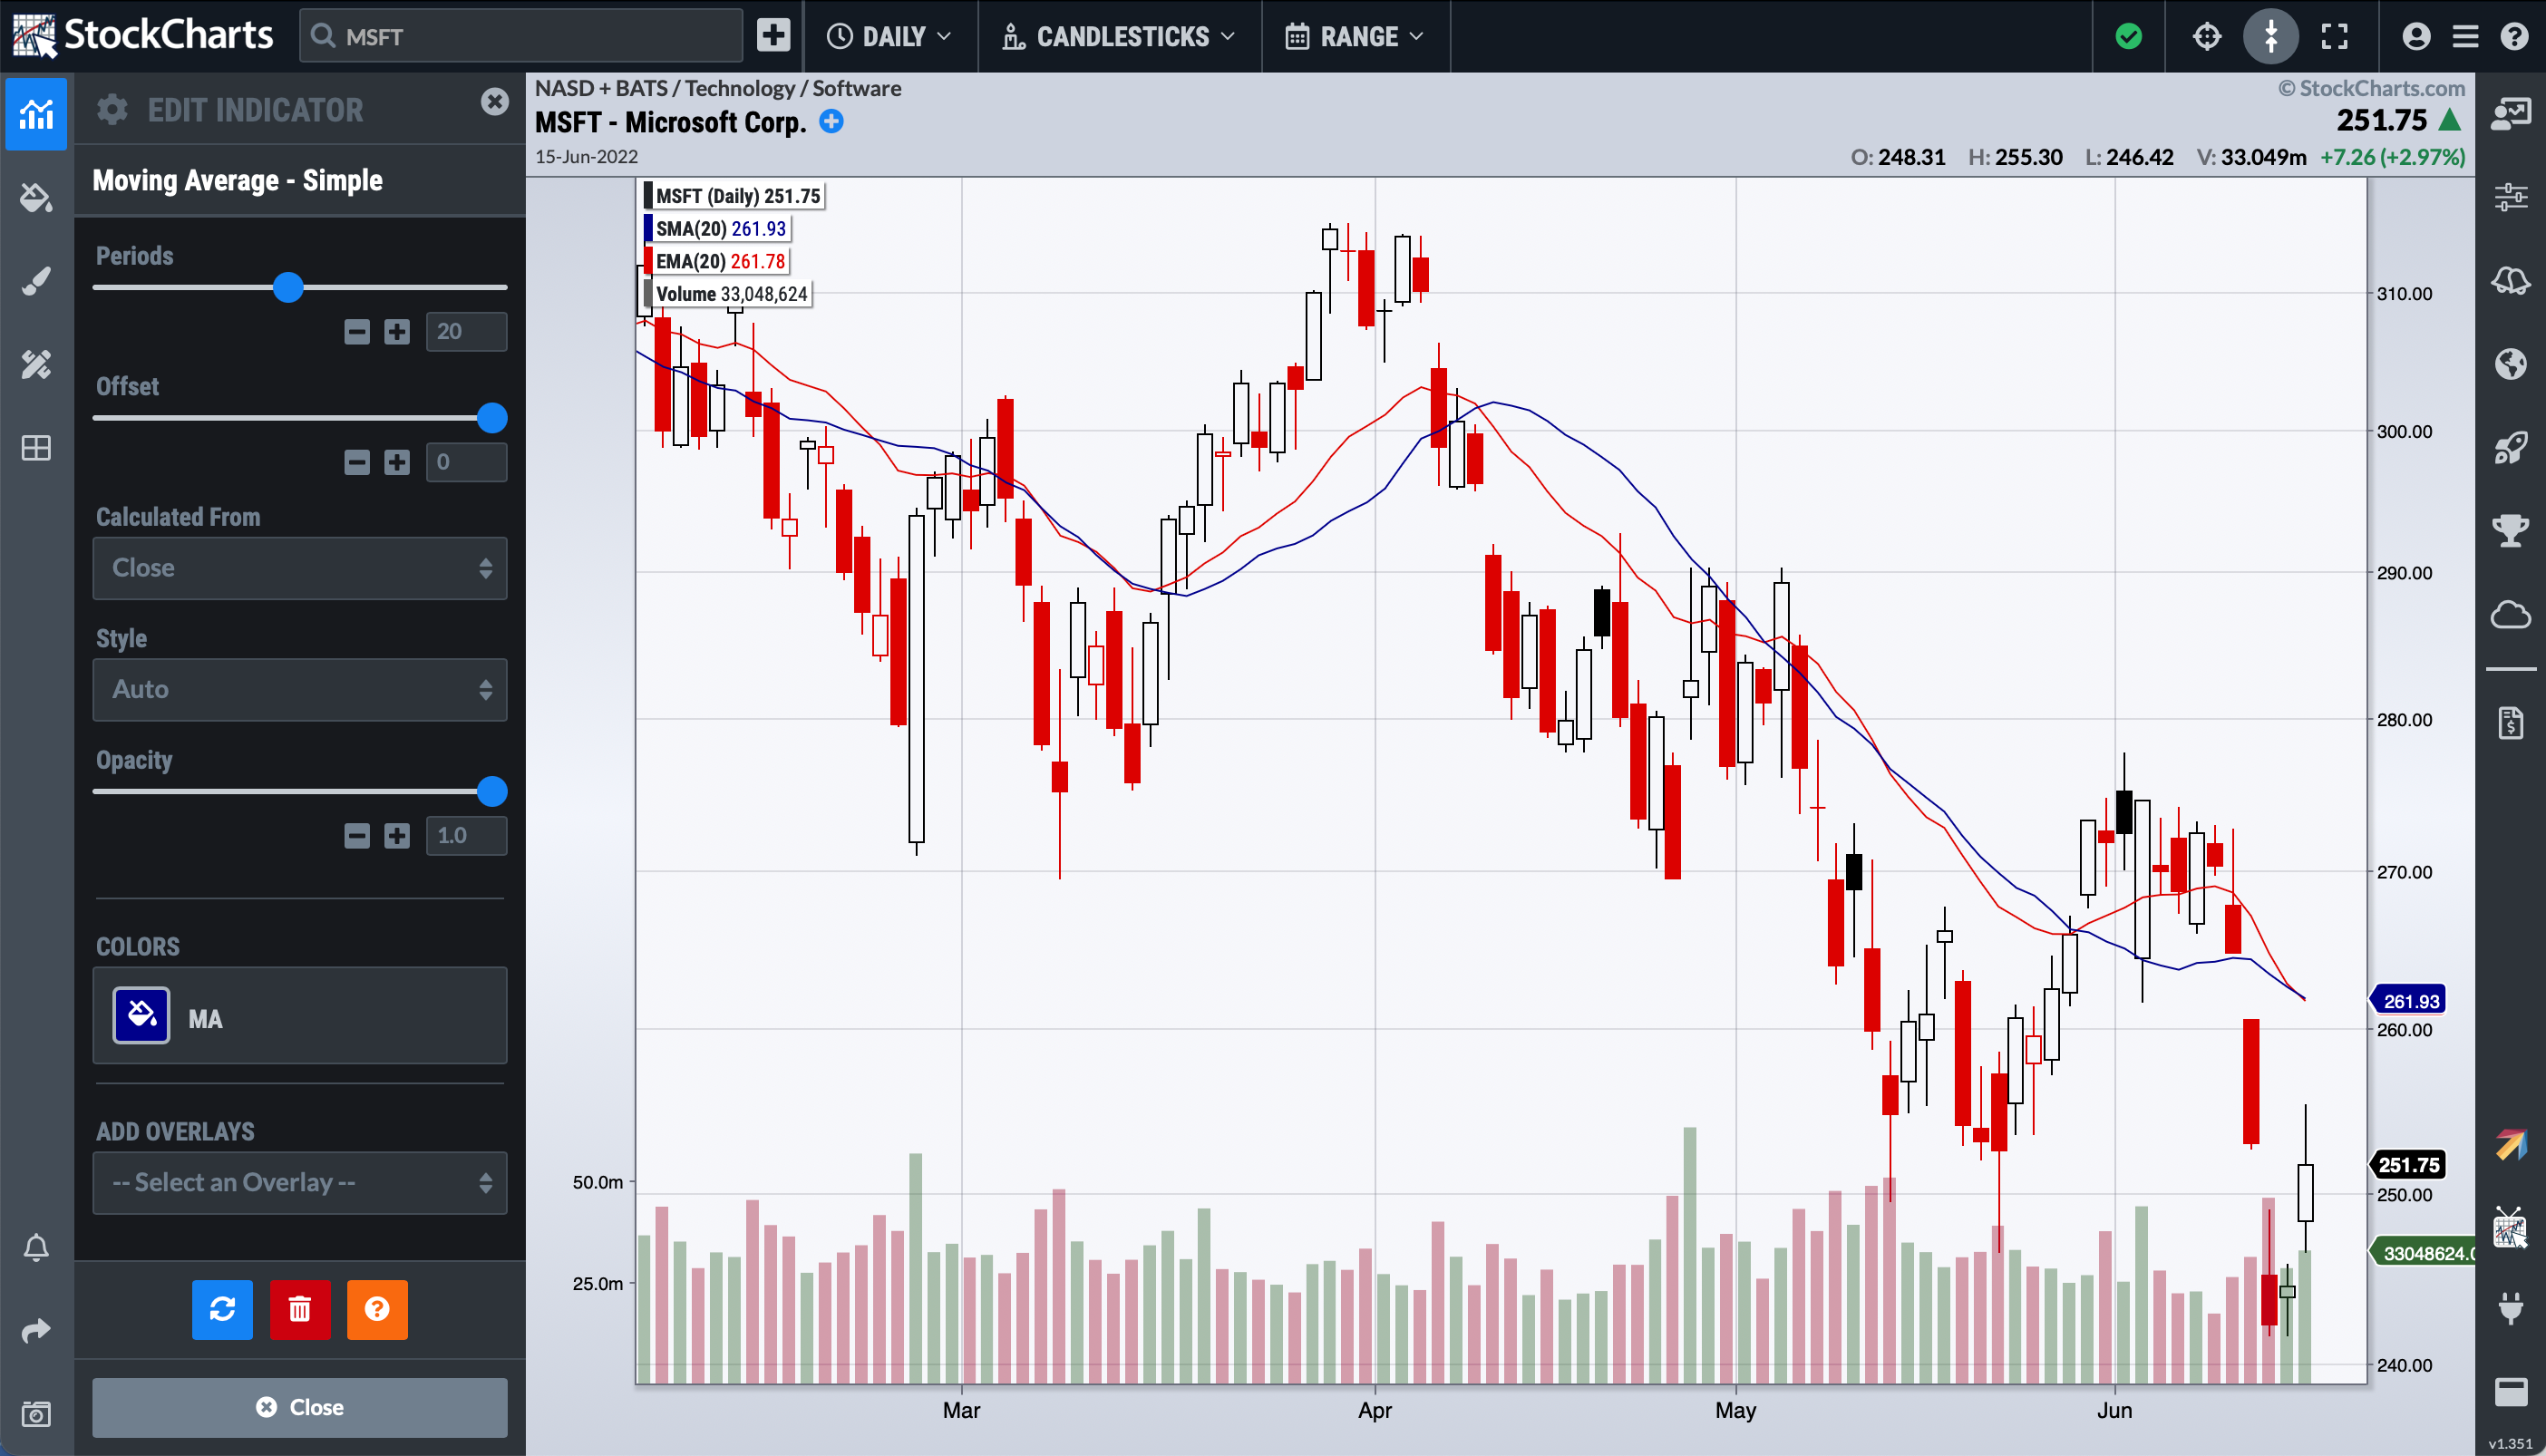
Moving averages are available in SharpCharts as a price overlay. Using the Overlays drop-down menu, users can choose either a simple moving average or an exponential moving average. There are several settings parameters allowed for moving averages, but only the first one is required:
- The first parameter is used to set the number of periods. By default, the Simple Moving Average overlay is set to 50 periods, and the Exponential Moving Average overlay is set to 20 periods. Still, these settings can be changed to fit your trading needs.
- An optional parameter can be added to specify which price field should be used in the calculations - “O” for the Open, “H” for the High, “L” for the Low, and “C” for the Close. A comma is used to separate parameters. If this parameter is unspecified, the Close is used by default.
- Another optional parameter can be added to shift the moving averages to the left (past) or right (future). A negative number (-10) would shift the moving average to the left ten periods. A positive number (10) would shift the moving average to the right 10 periods.
Multiple moving averages can be overlaid on the price plot by adding another overlay line to the workbench. StockCharts members can change the colors and style to differentiate between multiple moving averages. Note: If the style and color settings are not visible, click the green triangle to expand “Advanced Options”.

Moving average overlays can also be added to other technical indicators like RSI, CCI, and Volume. Click the “Advanced Options” triangle next to the indicator, and select a moving average from the Overlay dropdown menu.

For more details on the parameters used to configure Moving Average overlays, please see our SharpCharts Parameter Reference in the Support Center.
Using with StockChartsACP
Simple and Exponential Moving Average overlays can be added from the Chart Settings panel for your StockChartsACP chart. Moving Averages can be overlaid on the security's price plot or an indicator panel.
Click here for a live version of this chart.
Both moving average overlays use 20 periods by default, but this parameter can be adjusted to meet your technical analysis needs. Use the offset field to shift the moving average the specified number of periods to the left (past) or right (future). To calculate the moving average using data other than the Close, use the Calculated From field; this can be set to use the Open, High, Low, Volume, or other indicators on the chart.
Using with P&F Charts
Simple Moving Averages can also be overlaid on P&F charts. This overlay can be found in the Overlays section on the P&F Workbench.
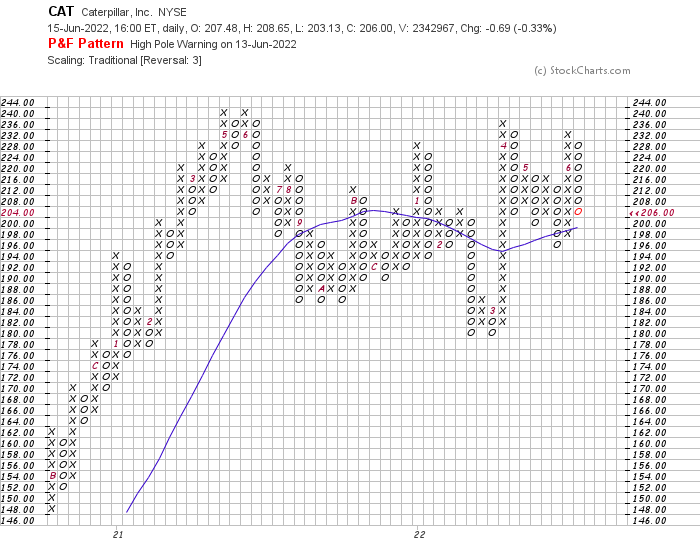
Click here for a live version of this chart.
By default, 20 periods are used to calculate the Simple Moving Average. However, since P&F moving averages are double smoothed, a shorter moving average may be preferred when placing this overlay on a P&F chart.
Learn More: Moving Averages on P&F Charts
Scanning for Moving Averages
StockCharts members can screen for stocks based on Moving Average values. Below are some example scans that can be used for Moving Average-based signals. Simply copy the scan text and paste it into the Scan Criteria box in the Advanced Scan Workbench.
Members can also set up alerts to notify them when a Moving Average-based signal is triggered for a stock. Alerts use the same syntax as scans, so the sample scans below can be used as a starting point for setting up alerts as well. Simply copy the scan text and paste it into the Alert Criteria box in the Technical Alert Workbench.
Bullish Moving Average Cross
This scan looks for stocks with a rising 150-day simple moving average and a bullish cross of the 5-day EMA and 35-day EMA. The 150-day moving average is rising as long as it is trading above its level five days ago. A bullish cross occurs when the 5-day EMA moves above the 35-day EMA on above-average volume.
[type = stock] AND [country = US]
AND [SMA(20,Volume) > 40000]
AND [SMA(60,Close) > 20]

AND [SMA(150,Close) > 5 days ago SMA(150,Close)]
AND [EMA(5,Close) > EMA(35,Close)]
AND [Yesterday's EMA(5,Close) < Yesterday's EMA(35,Close)]
AND [Volume > SMA(200,Volume)]
Bearish Moving Average Cross
This scan looks for stocks with a falling 150-day simple moving average and a bearish cross of the 5-day EMA and 35-day EMA. The 150-day moving average is falling as long as it is trading below its level five days ago. A bearish cross occurs when the 5-day EMA moves below the 35-day EMA on above-average volume.
[type = stock] AND [country = US]
AND [SMA(20,Volume) > 40000]
AND [SMA(60,Close) > 20]

AND [SMA(150,Close) < 5 days ago SMA(150,Close)]
AND [EMA(5,Close) < EMA(35,Close)]
AND [Yesterday's EMA(5,Close) > Yesterday's EMA(35,Close)]
AND [Volume > SMA(200,Volume)]
For more details on the syntax to use for Moving Average scans, please see our Scanning Indicator Reference in the Support Center.
Moving Average FAQs
What is the purpose of a moving average?
A moving average helps to smooth price action and filter out noise in the data. It is used to identify trend direction, define potential support and resistance levels, and serves as a building block for many other technical indicators.
How does the lag factor affect moving averages? Moving averages tend to lag behind price data because they are based on past prices. The longer the moving average, the more it lags. EMAs, which are more weighted toward recent data, lag less than SMAs, which give equal weight to past data.
What are the ideal lengths of moving averages for different trading horizons?
Shorter moving averages (5-20 periods) are suitable for short-term trends and trading. Medium-term trends can be analyzed using longer moving averages (20-60 periods). Long-term investors often use moving averages with 100 or more periods.
Can moving averages be applied to other types of data?
Yes, moving averages can be applied to other types of price data, such as open, high, or low prices, as well as volume data or other indicators. The choice depends on the specific analysis and objectives.
How can moving averages be used to generate trading signals?
Moving averages can be used to generate trading signals. One of the most basic techniques is that of using crossovers. A bullish crossover occurs when a shorter moving average crosses above a longer moving average, indicating a potential buying opportunity. A bearish crossover occurs when a shorter moving average crosses below a longer moving average, indicating a potential selling opportunity. Note that there are several other ways to use moving averages to generate trading signals.
Additional Resources
ChartSchool Articles
Arthur Hill on Moving Average Crossovers
Learn about the limitations of using trading systems based solely on moving average crossovers.
Stocks & Commodities Magazine Articles
Trade with Moving Averages by Colin Alexander
May 1993 - Stocks & Commodities V. 11:6 (257-260)
Applying Moving Averages by John Sweeney
Mar 1998 - Stocks & Commodities
Recommended Books
John Murphy's Technical Analysis of the Financial Markets contains a chapter devoted to moving averages, their various uses and their pros and cons. In addition, Murphy shows how moving averages work with Bollinger Bands and channel-based trading systems.
| Technical Analysis of the Financial Markets John Murphy |
 |
 |